SlideMagic Blog

Frequent updates about all things presentations since 2008. Subscribe to never miss a post.

RSS
all posts

Category Software

·Keynote

Keynote versus PowerPoint

The year 2012 could be the tipping point for Apple’s presentation design software Keynote. Only now I get multiple requests from clients to start designing presentations in this format. Especially smaller companies and startups who have the privilege to be able to decide on a 100% Mac IT infrastructure are the pioneers. So, over the past month it has been the first time that I had the opportunity to use Keynote on an industrial scale, on time critical presentation design projects.

Most Keynote versus PowerPoint evaluations on the web count the number of features, slide transition effects, or the quality of the built-in themes. So this is maybe the explanation why these features get some much prominence in marketing of both products. Personally, I find them the least important aspects of the software. What matters is how easy your workflow is: manipulating objects, changing the order of slides, managing images, creating and editing data charts. My review will focus more on these issues.

People say that the best Apple products are those that Steve Jobs used frequently personally, and Keynote is such a product, and it shows. The interface is lighter, fresher, simpler without PowerPoint’s baggage of older versions.

The concept of the inspector window with the properties of any object you click at (image, shape, graph, text) is incredibly useful and time saving compared to looking for the right menu in PowerPoint.

One of the biggest pains of PowerPoint 2011 are the drawing guides that you cannot lock. Re-size an object near the blue drawing guide, and tsjak, off she goes. Not so in Keynote. Aligning, positioning is all easier and cleaner.


Continue reading →
·Data visualization

How to export a chart from Excel to PowerPoint?

Yesterday’s post triggered this question: how to export a chart from Excel to PowerPoint? The short answer: copy the data not the chart.

Standard Excel charts are ugly, they have the wrong formatting, they have the wrong colors, axis labels are in the wrong place, data is not rounded up and too precise. Copying and pasting an Excel chart into PowerPoint is also copying all that ugliness. Even worse, copying and pasting it as a picture might make it look blurry.

I believe that data charts in a PowerPoint presentation deserve careful attention and need to be designed by hand. You start by inserting a blank, ugly, PowerPoint chart into your slide, next copy the data across from Excel and then start tweaking until it looks perfect.

Once you have done one, you can use that PowerPoint chart as a template for other charts in your presentation.

·Keynote

Zapping double Keynote shadows

Usually I blog about grander things than software tricks. Today is an exception with a help-desk-type post. This thing drove me crazy in Keynote: a double drop shadow that just did not want to go away in the data labels of a chart. If I am struggling to find it, there must be a few other people out there getting annoyed by this. Here is a video that explains how to get rid of these ghost shadows. The fonts button at the top right of the screen has some hidden options.


·Books

Apple iBooks and presentations

Two main take-aways from the announcement by Apple yesterday about the new platform to design and publish interactive books for the iPad:

  1. It removes the excuse that the lizard brain inside me used so far to stop me from writing a book: the thousands of dollars and months in training I would have to invest to port an InDesign document to a working iPad app. Here you go, I committed publicly.
  2. This platform can be fantastic to write investor and sales pitch documents for one-on-one meetings or sending to a prospect before you meet face-to-face. The standard for the boring text “Executive Summary” just got raised in such a way that people might actually start to read them.

·PowerPoint

Re-ordering objects

Despite my 10,000 hours of PowerPoint I never bothered to push the re-order objects button in the arrange menu (Mac). Hey, and out came a nice interface to make things to the front or to the back of the slide.

·Data visualization

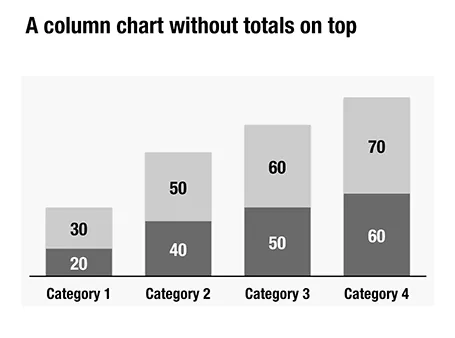
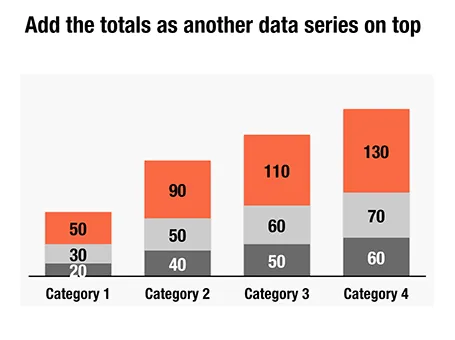
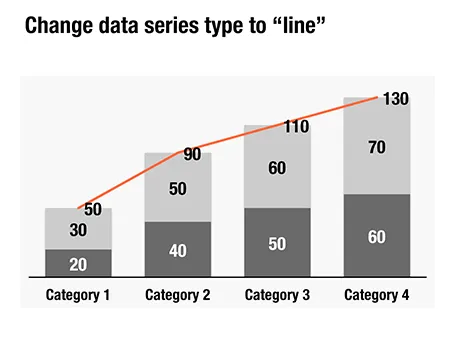
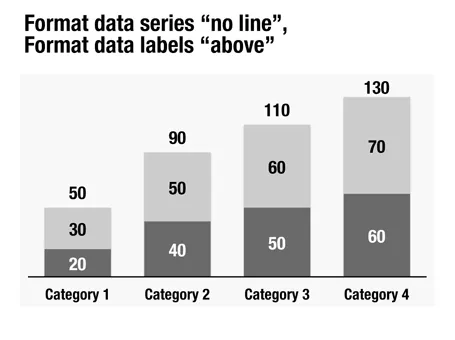
Column chart with totals

Here is a little trick to create automatic totals on top of column charts. This is an alternative to placing text labels manually, and especially useful when the data in the column charts is changing frequently.

·Images

Subtle reality distortion

Subtle reality distortion in Photoshop can give great results. One of my favorite uses is a black and white background with a small logo or item in color added into it. Here an image of another Idea Transplant truck on its way to a happy client with a little help of the Photoshop vanishing point filter.

·PowerPoint

Hard-to-find Excel 2011 shortcuts

I do not use many Excel keyboard shortcuts. But my switch from Windows to Mac OSX showed that I really was dependent on a few that were hard to find in my new software. Maybe you have the same issue.

  • In Windows, I constantly used the Office 2010 (Windows) CTRL-MINUS and CTRL-PLUS to add/remove columns and rows. For some reason CTRL-PLUS does not work in Office 2011. To insert a row or column on the Mac, select it and hit CMD-I instead.
  • I use the soft line break in an Excel cell a lot, on the PC it is ALT-ENTER, on the Mac it is ALT-CMD-ENTER.
·Hacks

An iCloud-style cloud in PowerPoint

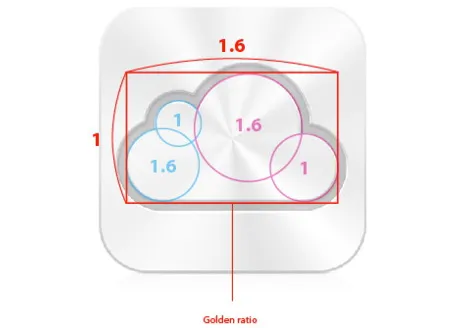
I often need a cloud shape in PowerPoint to draw a network diagram. The standard PowerPoint cloud is not very pretty. Here is a way to construct a new cloud shape in the style of the logo of the iCloud service by Apple.

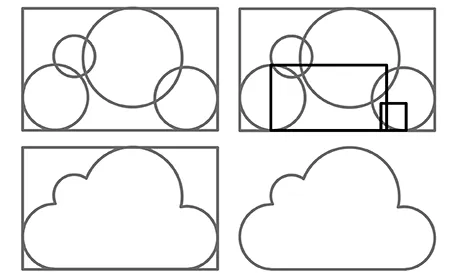
Takamasa Matsumoto originally discovered how the iCloud logo is infused with golden ratios. If you use these proportions to draw some basic shapes in PowerPoint, you can combine them using the shape union command (on the Mac right click the selected shapes, go into grouping and select union). You see that I use 2 extra rectangles to fill up the shape.

Here is the final result compared to the standard PowerPoint cloud shape, with heavier lines around the shape.

·Investor presentation

Investor presentation in HTML

Have a look at the DressRush investor presentation, an entire pitch deck written as a web site, in the public domain. Some of my observations.

I like publicly available investor pitches. It fits in the wave of increasing transparency in the startup funding market. (Check out Angel List). Startups can dramatically increase their access to potential investors by making part of their content public. The first stage of a fund raising round does not have to be the closed meeting room of the VCs that happen to be located in the same city as you are. Obviously you would not put your core IP, financials, or other sensitive strategic content in a public presentation. Another option would be to make the sensitive part of your investor pitch on your web site pass word protected.

I like these airy web sites. Lots of white space and information that you can scroll through freely, up and down. I actually first skim the whole site in a few seconds, then go back up to start reading in more detail. This is so much better than the nervous clicking on a small button in a SlideShare window (especially when people design slides that -click- break up -click- a sentence -click- in 5 -click- slides.

It is still tricky to design from this new medium though. The DressRush example uses beautiful muted colors (interrupted here and there by images and facebook logos) and takes an infographic approach to investor pitches. On certain pages it works, on others it does not. In whatever direction the technology develops, you still will need to eye of a good designer to get your investor pitch right, also in HTML.

Continue reading →