SlideMagic Blog

Frequent updates about all things presentations since 2008. Subscribe to never miss a post.

RSS
all posts

Category Presentation design

·Design

Benoit Mandelbrot 1924 - 2010

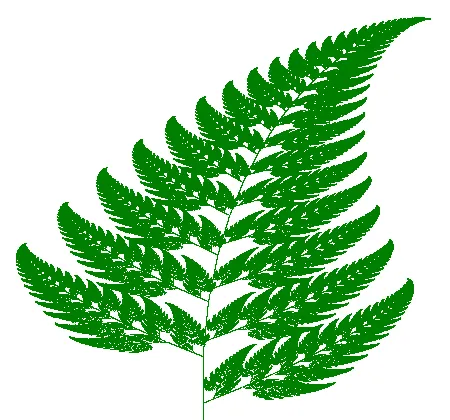
Benoit Mandelbrot passed away. He coined the term “fractal”, an endless shape that can be characterized with a relatively simple numerical pattern, leading to some very beautiful visualizations. It always fascinates me how shapes in nature can be defined with a strikingly simple code.

Image credit Wikipedia.

As an example, an artificially created leaf (Wikipedia source):
·Design

The last slide in your presentation

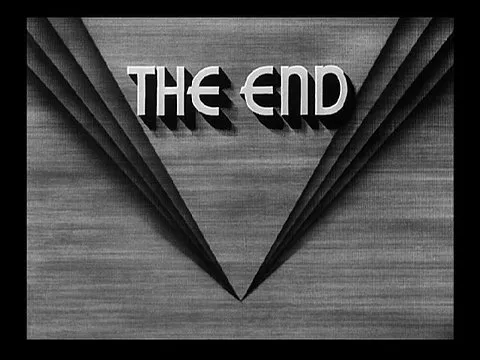
I came across this closing screen of an ancient King Kong movie (via FFFound).

  1. Vintage closing screens actually make a nice final slide of a presentation, you Google lots of them
  2. Always close your presentation with a sentence that makes it clear that the presentation comes to an end. “End that is how…”. Don’t say explicitly “well, this is the end”. Let questions come up spontaneously, and don’t say: “OK, I have time for 5 questions”, there just might be chance that no questions will come up (a bit awkward). I have seen many great presentations without questions.
·Books

Learning from ancient folk stories

I was just reading some stories from Nelson Mandela’s Favorite African Folktales(affiliate link) to my kids and realized how much you can learn from them to create short anecdotes that fit inside your bigger presentation:

  • Very short
  • One to three simple (almost stereotypical) characters
  • Something happens at turn 3. “On the 3rd day…”
  • An unexpected twist at the end: “and this is why monkeys became so good at climbing trees”

These tales were designed to be remembered and passed on for generations. How long does your slide deck stick?

·Data visualization

Two pies - too much

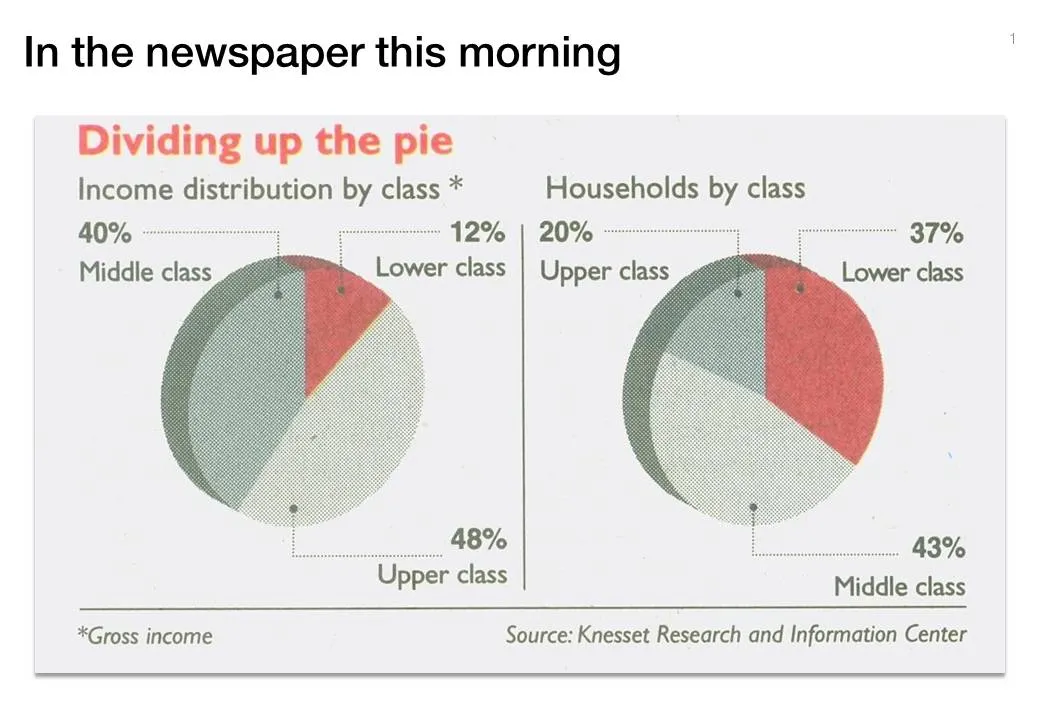
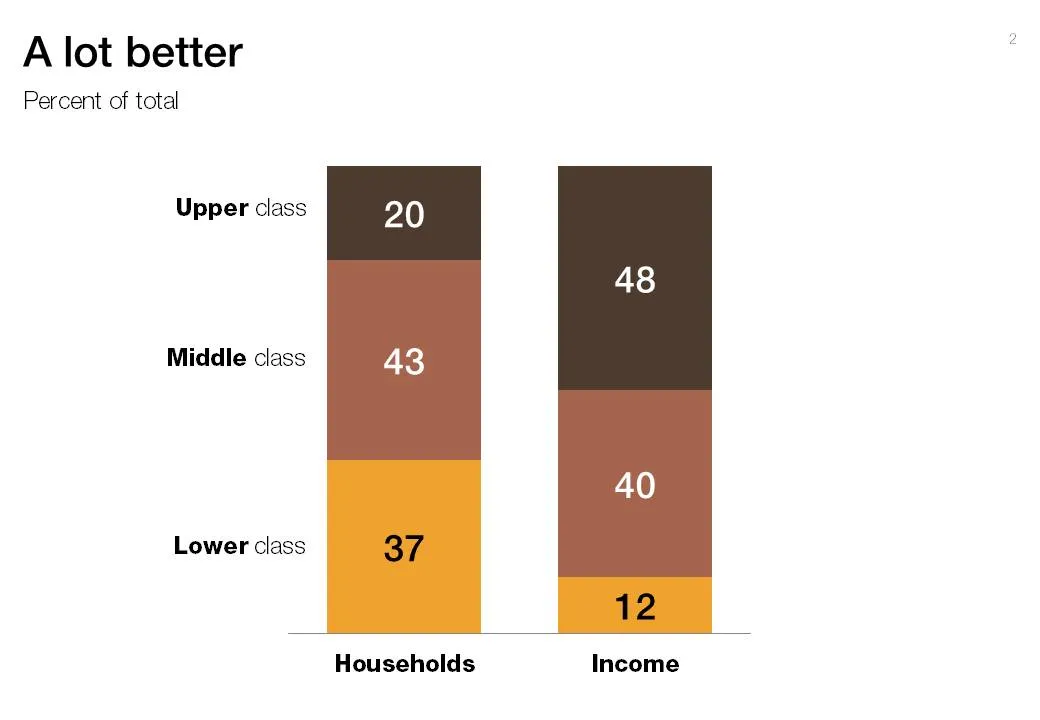
Pies are great to show relative sizes of surfaces, better than bars or columns. When it comes to comparing breakdowns on multiple dimensions though, the column chart cannot be beaten. See this example taken out of Haaretz this morning. What did I fix:

  1. Two columns instead of two pies
  2. Get rid of the 3D effects (earlier post)
  3. Use consistent coloring for data series
  4. Use consistent ordering for data series
  5. First the chart with the number of households, then the chart with the breakdown of income

·Concepts

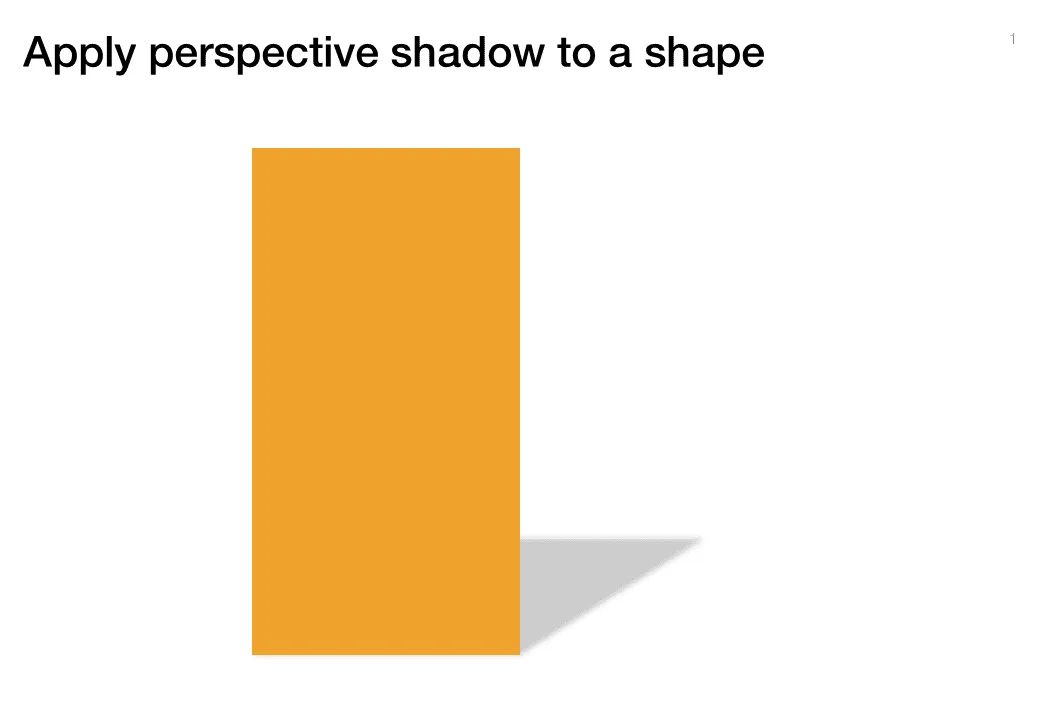
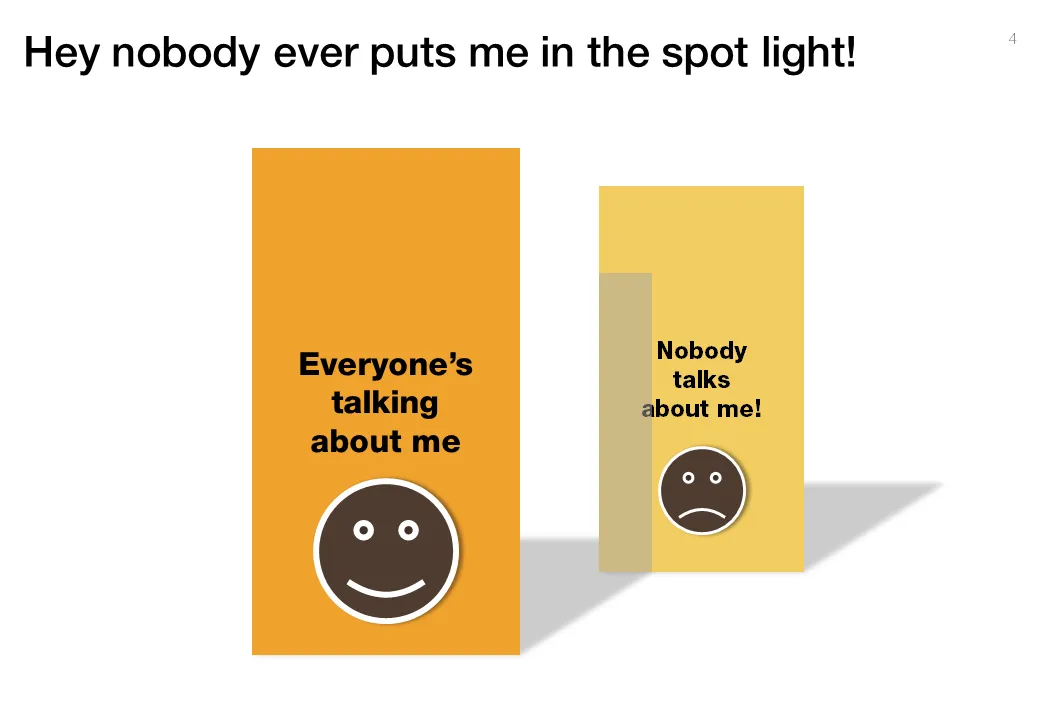
Chart concept - standing in the shadow

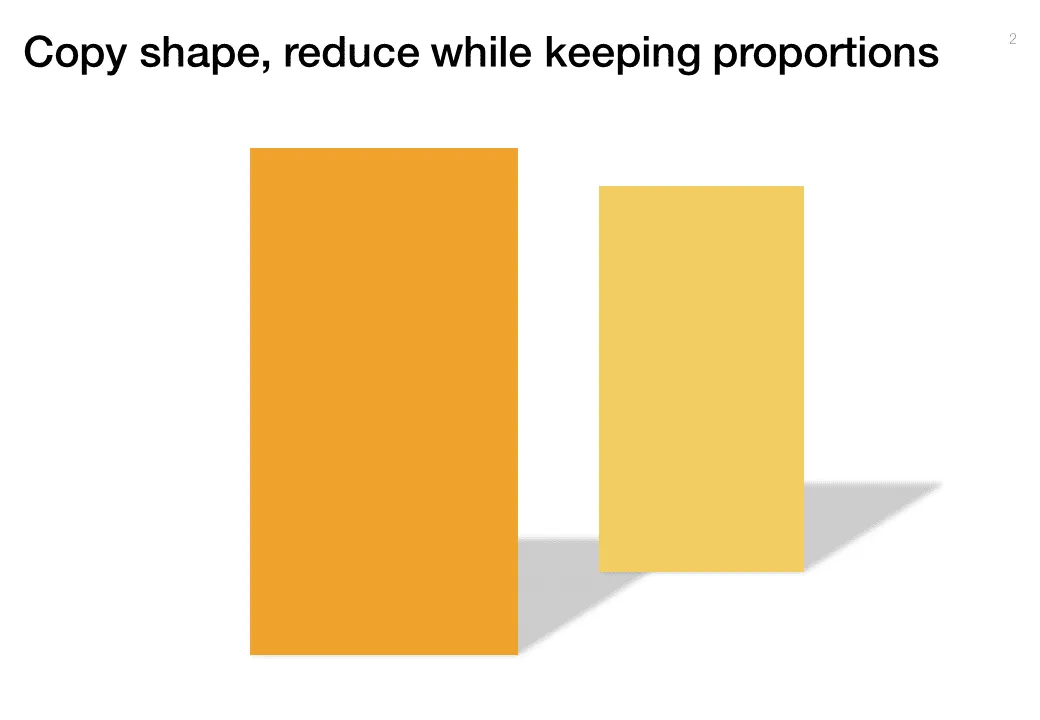
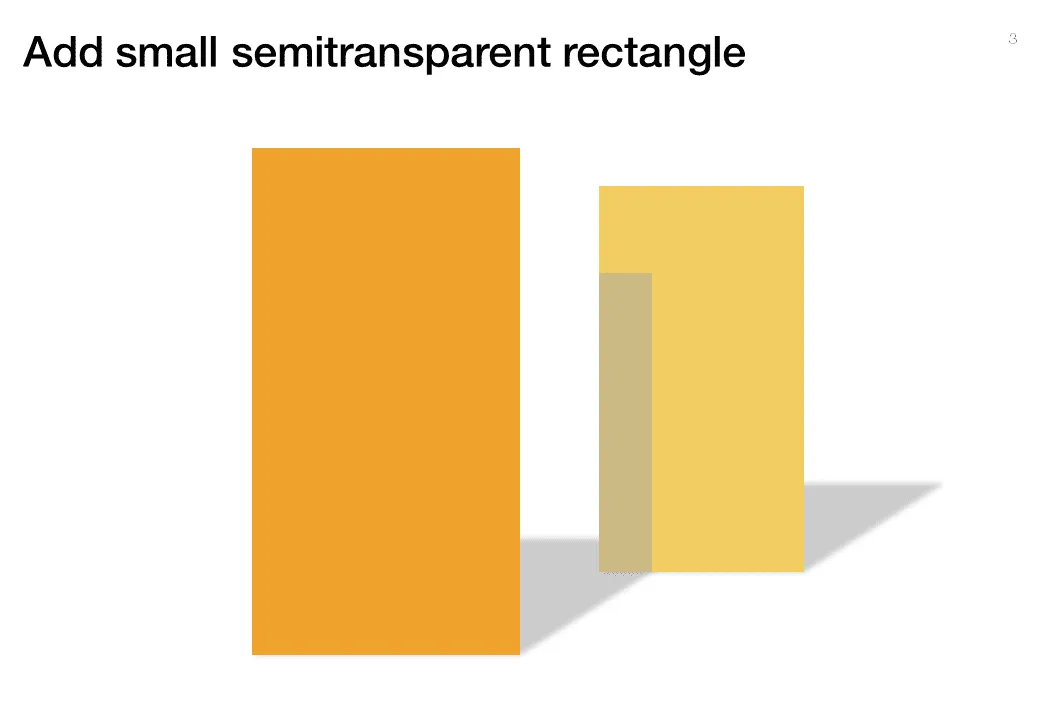
Some issues/people get all the attention, while others never get discussed. The chart below looks a bit like a child’s drawing, but the point is to show how you can play with shadows to create the effect.

·Design

Fundraising dialogue going wrong

Highly amusing video of a fund raising discussion. In many pitch discussions, people talk at each other, but are not really listening, talking to each other. Created by ITHAYER.

·Data visualization

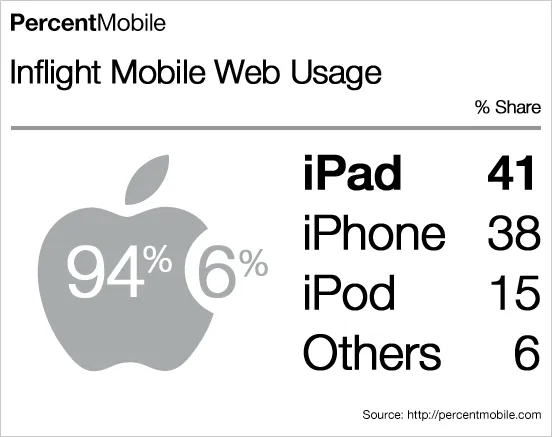
Blending data and typography in a chart

What a nice chart by Mobile Analytics. Perfect blend of data, logos/icons, and typography.

·Design

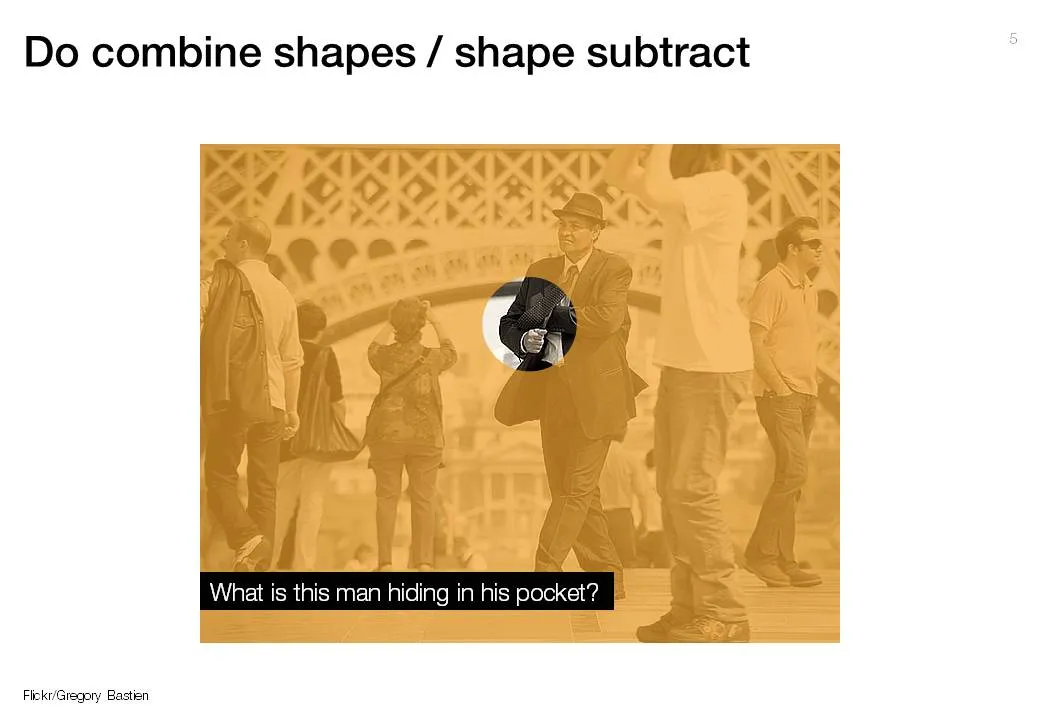
Making cut outs using shape subtract in PowerPoint

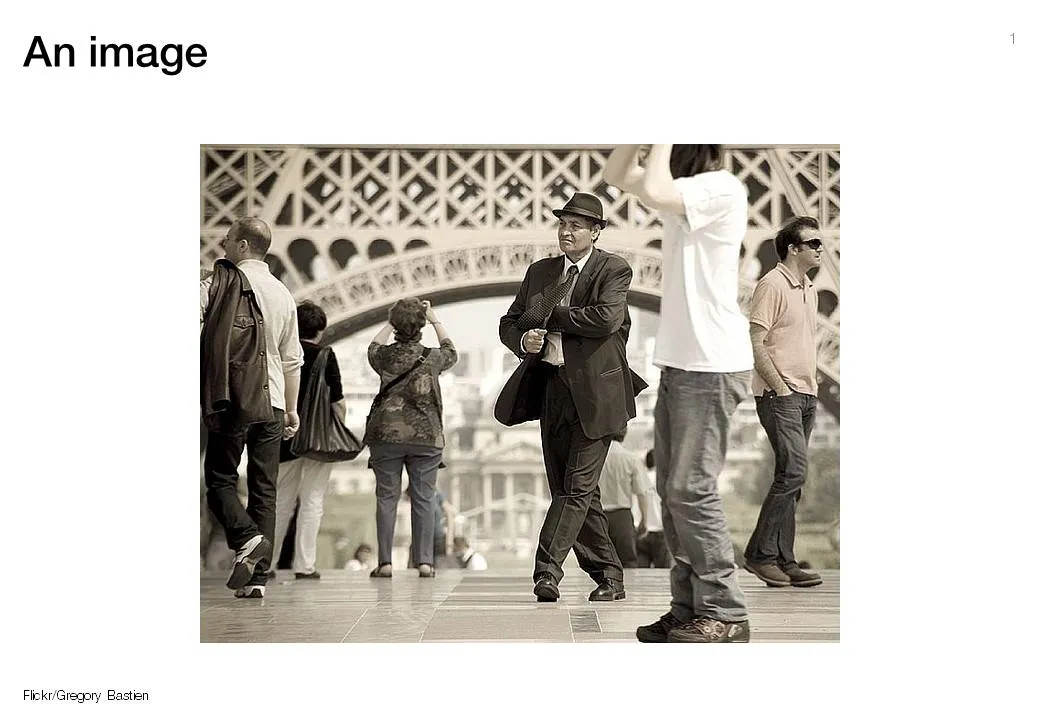
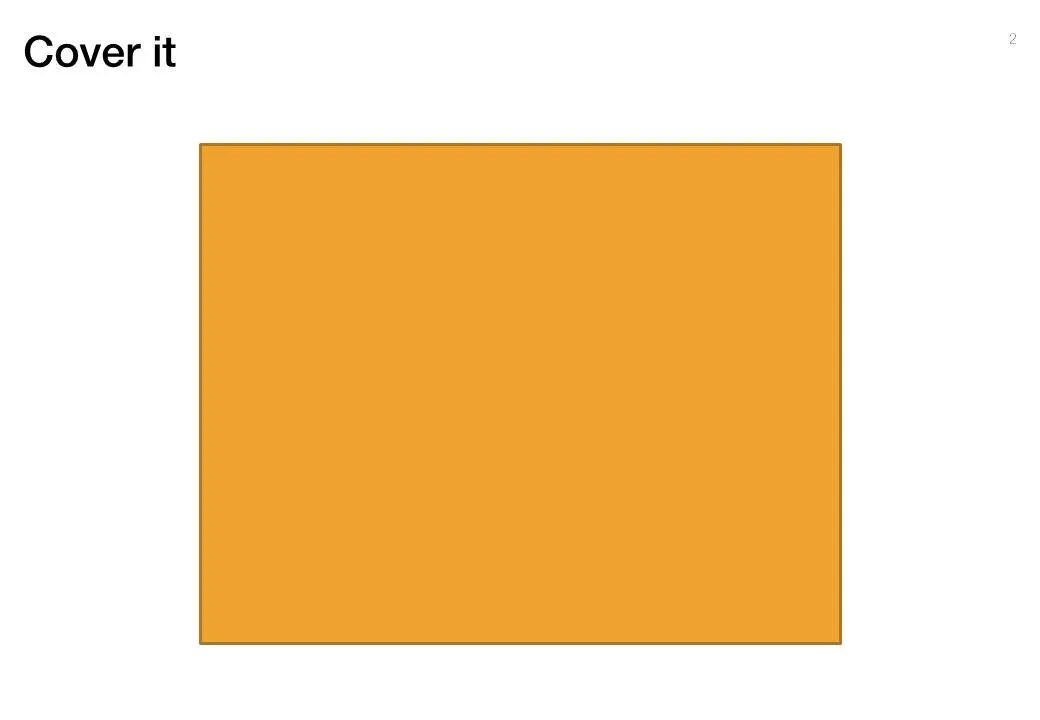
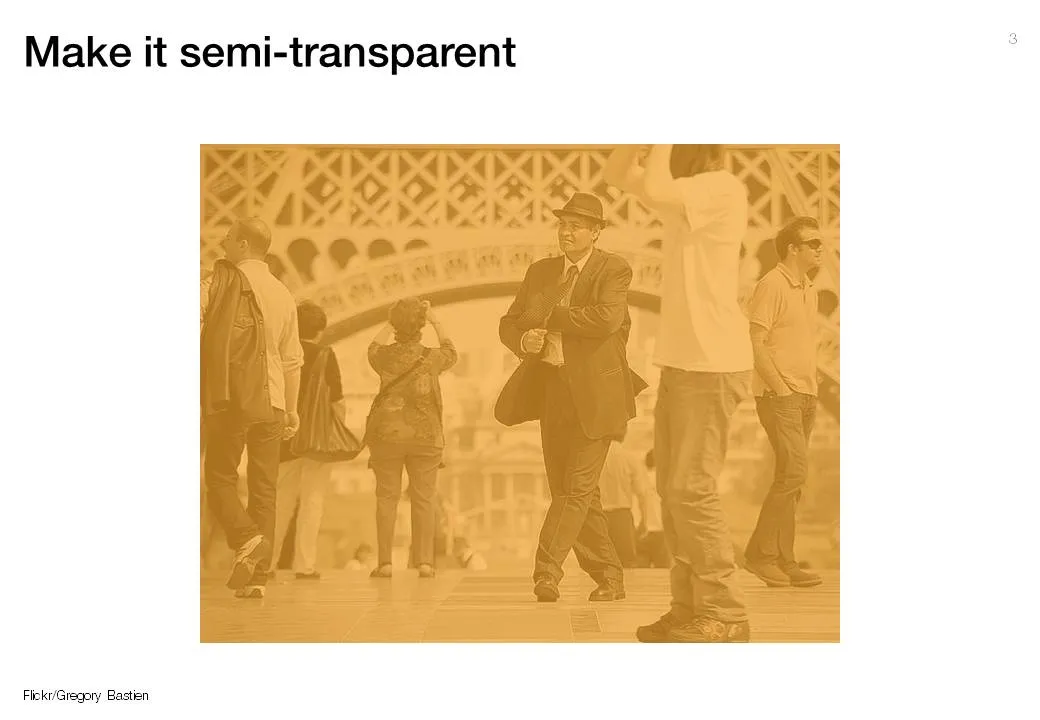
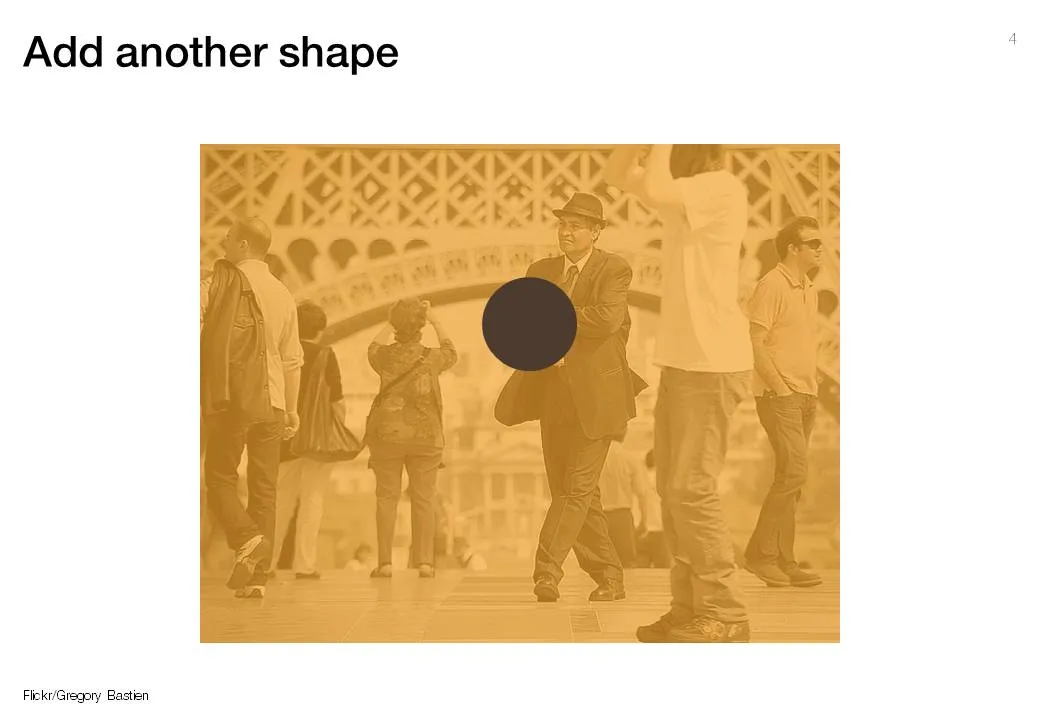
The new shape subtract feature in PowerPoint 2010 (review) enables you to make shape cutouts in a more elegant way than before (see the old approach here). A step-by-step guide using a great image by Gregory Bastien.

·Art

The secret to great presentation design is...

The bar has been put higher and higher over the past years:

  • Everyone is now able to put text and charts in PowerPoint and project them on a screen
  • (Almost) everyone has discovered where to get beautiful page-filling images
  • Many people have figured out how to clean up a messy data chart
  • More and more people are learning to apply professional typography (PowerPoint gets a bit closer to Illustrator with every release) and coherent color schemes

What is left that is hard to do is the “art part”. It can never be automated. Sequencing the right story, knowing what to cut, what to keep in, picking the right analogies, selecting the right images, picking the exact right data visualization option…

·Design

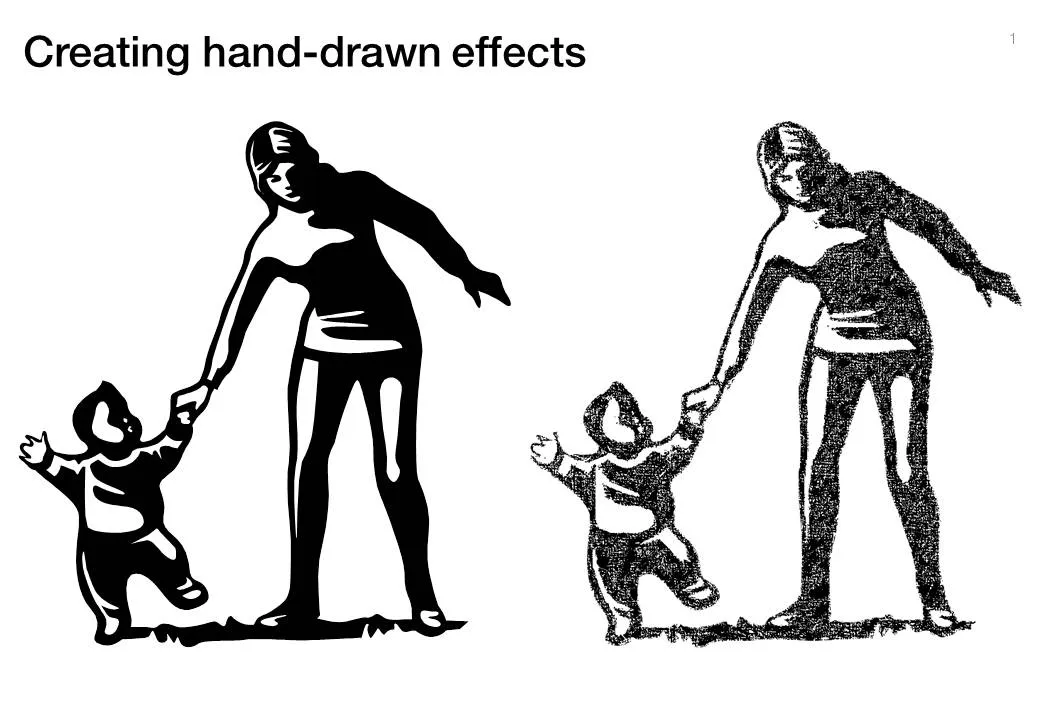
Hand-drawn figures in PowerPoint

Another excellent clip art manipulation on Tom’s Rapid e-learning blog: how to create characters with a hand-drawn feel:

  1. Select a cartoon-style clipart
  2. Ungroup and strip out background elements
  3. Copy and paste as PNG
  4. Apply PowerPoint 2010’s new pencil sketch filter (or use Photoshop’s)
  5. Increase brightness, soften contrast a bit.