SlideMagic Blog

Frequent updates about all things presentations since 2008. Subscribe to never miss a post.

RSS
·PowerPoint

This presentation tool is not a presentation tool

PowerPoint, Google Slides are presentation tools that most of the time are actually not used as presentation tools. Rather people use them as a visual collaboration tool. The organization chart that needs to go into the deck forces the issue: it is time to agree on where the boxes sit and which lines (dotted or straight) go between them. The tiny footnote is essential to agree the strategy for the North America entry strategy etc.

The visual character of these programs makes them more useful to do this than word processors. Online collaboration adds another option to manage multiple pens in one document. Comments give a system to manage todo lists.

SlideMagic on the other hand is a presentation tool.

Image credit: Jay Cross on Flickr
·SlideMagic

PDF glitch fixed

There was a small glitch in SlideMagic’s PDF converter which has been fixed in version 2.7.2, updates should install automatically, if not, download a fresh version from www.slidemagic.com and you are good to go.

·Delivery

Convincing the decision maker

A big meeting is not the right setting to convince a single decision maker. A lot of her subordinates are around and showing doubt is showing weakness. So the interactions before that all-important presentation is where the real work gets done.

OpenAI image generation now live

I added Dall.E image generation as a fourth option to insert images in SlideMagic (next to Unsplash, Pixabay, and Noun icons). Maybe SlideMagic is the first presentation app in the world to integrate OpenAI, who knows.

Below you see how it works:

 Step 1: select ‘online’ as your image source

Step 1: select ‘online’ as your image source

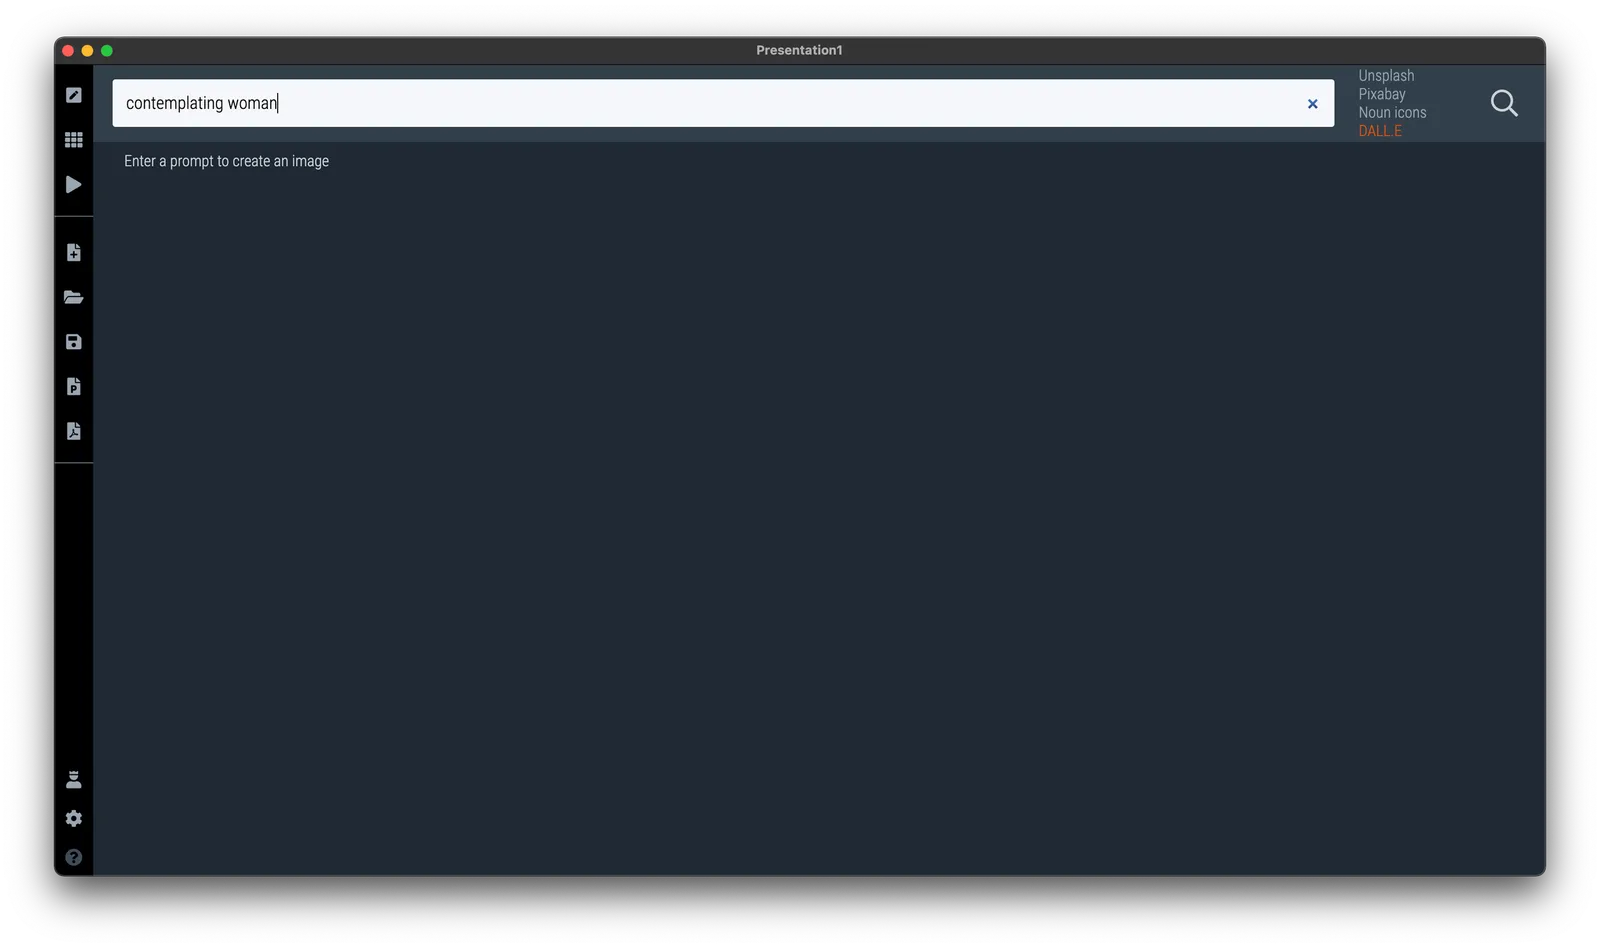
 Step 2: add your prompt in the search bar of SlideMagic (usually you would enter image search keywords here)

Step 2: add your prompt in the search bar of SlideMagic (usually you would enter image search keywords here)

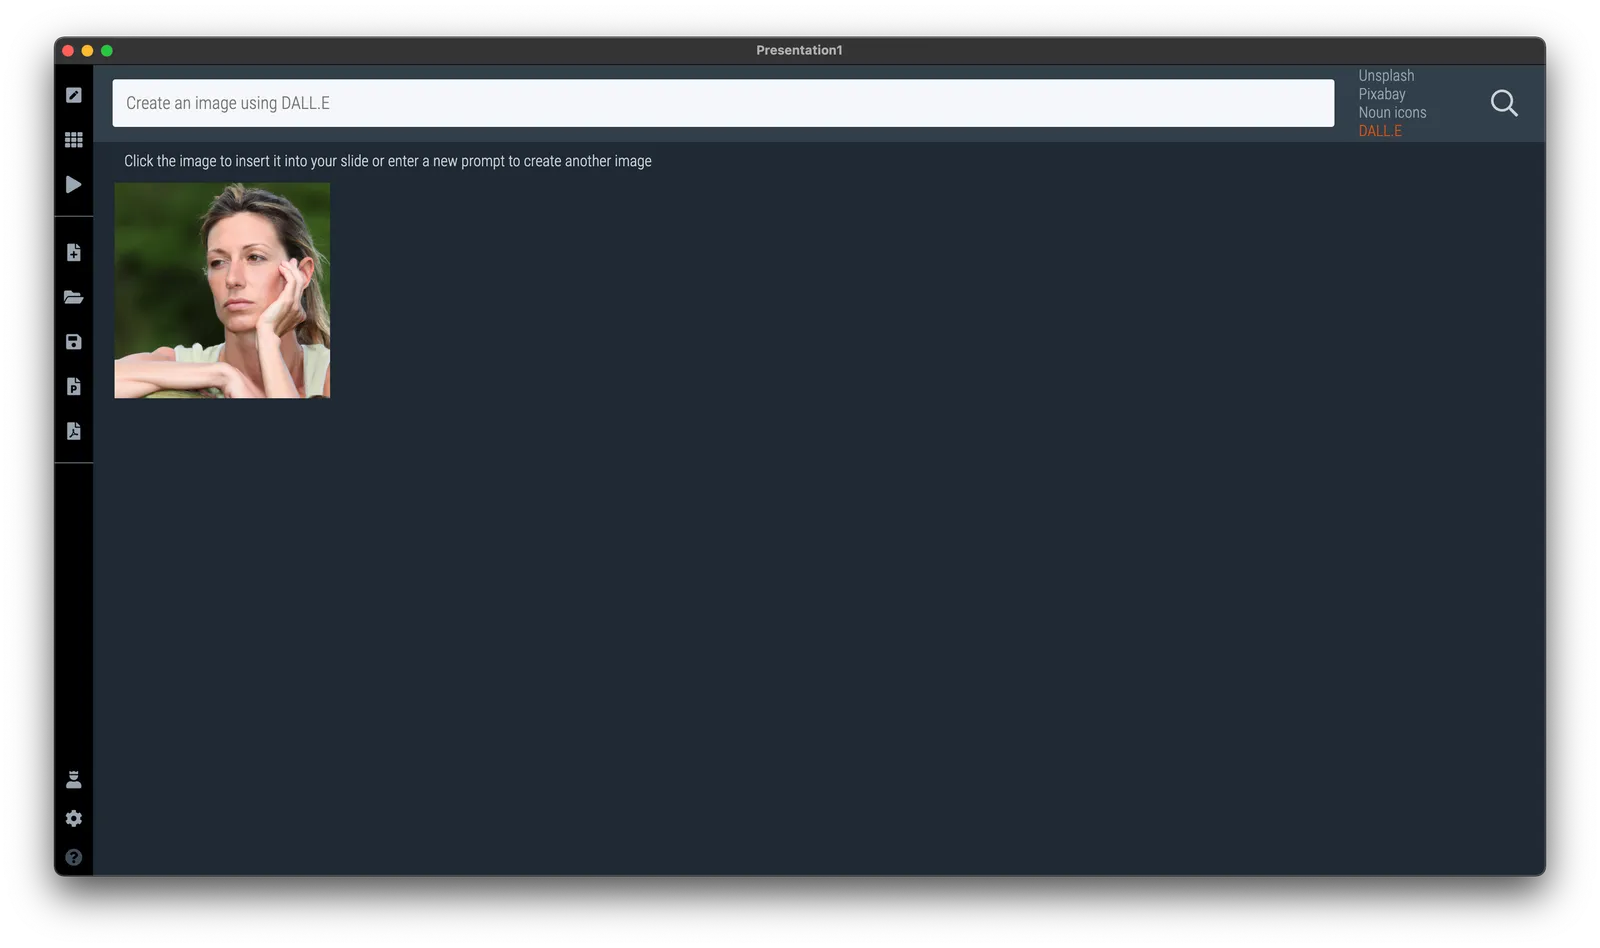
 Step 3: preview your image, it will take slightly longer for the result to come back given the amount of pixel processing that is going on

Step 3: preview your image, it will take slightly longer for the result to come back given the amount of pixel processing that is going on

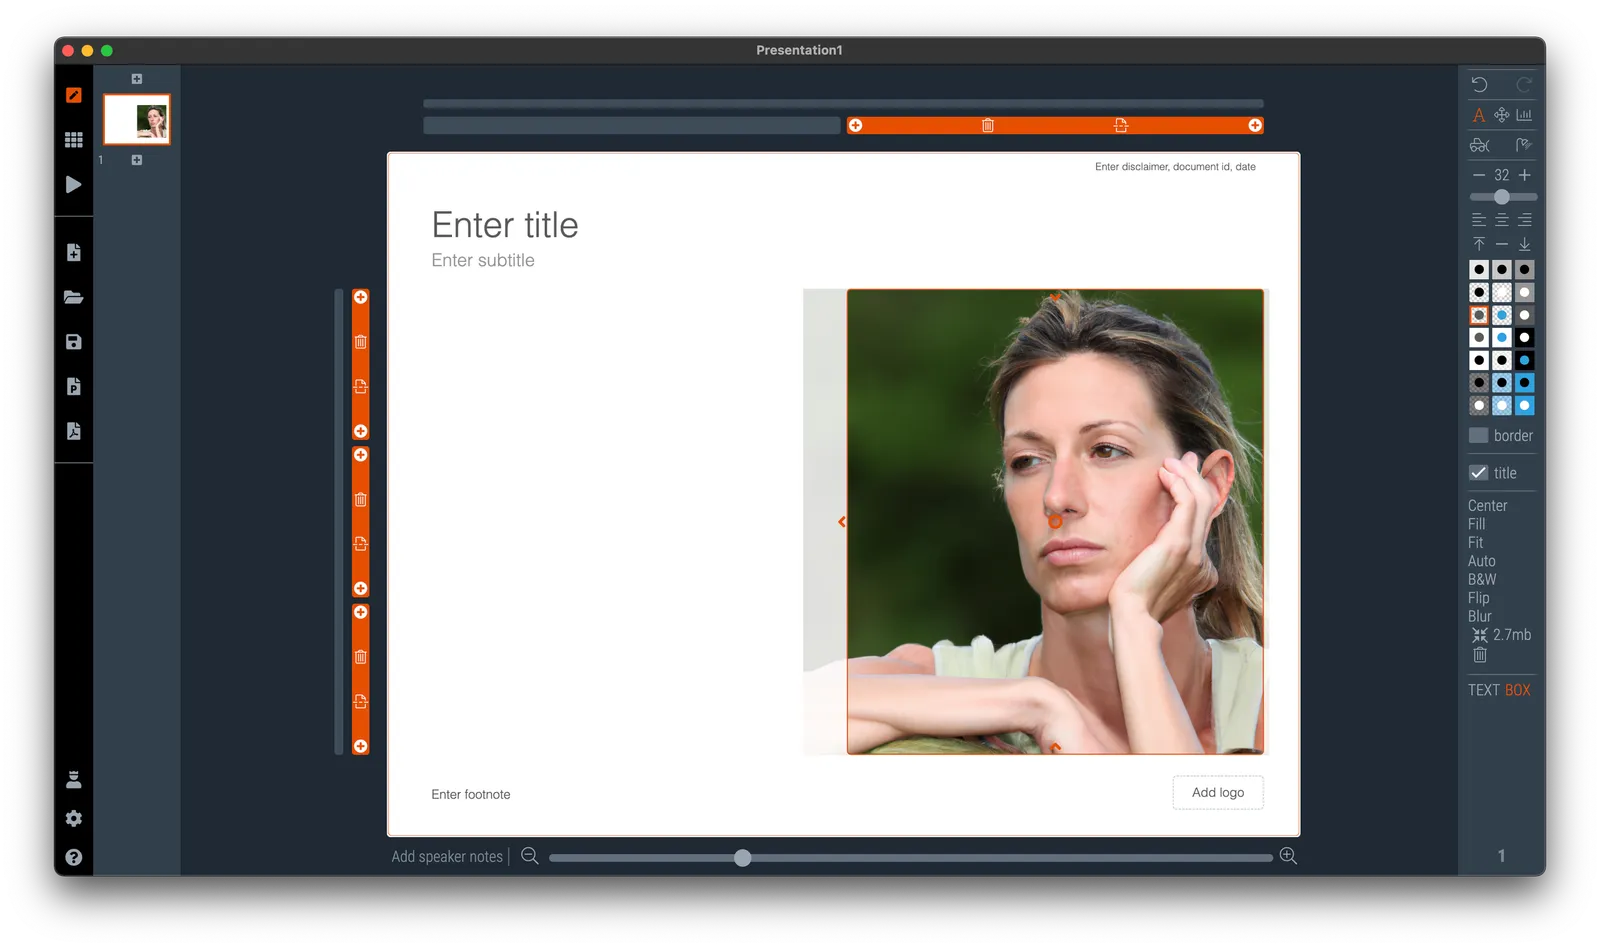
 Step 4: click the image to add it in your presentation. The previous “AI” feature in SlideMagic should make sure that if the image is a portrait, cropping is done automatically and sensibly.

Step 4: click the image to add it in your presentation. The previous “AI” feature in SlideMagic should make sure that if the image is a portrait, cropping is done automatically and sensibly.

There are cost involved with generating these images, hence I switched on the feature for Pro subscribers only. Make sure version 2.7.1 of SlideMagic is installed for this feature to work. Your app should update automatically. If not, download a clean version from the web site and log back in to your account.

Continue reading →
·SlideMagic

Working on integrating OpenAI

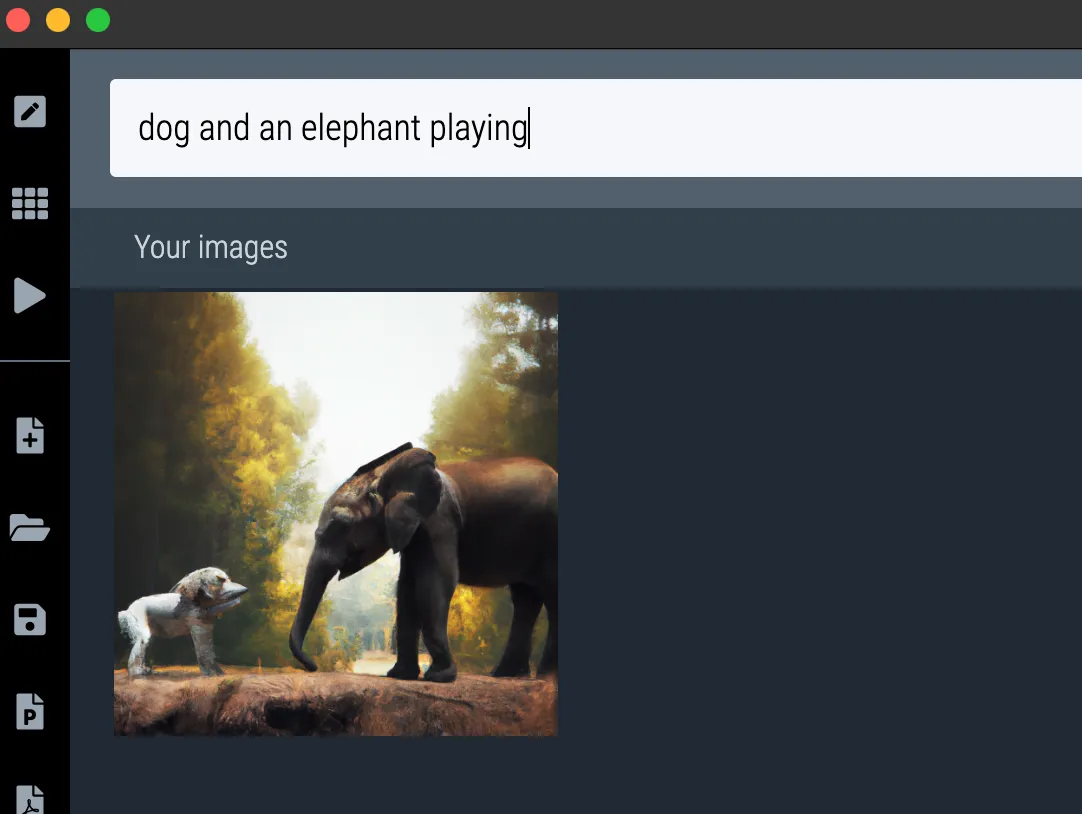
Soon, SlideMagic Pro users will be able to create images using AI (DALL.E) right from within SlideMagic. The prototype is working (see screenshot), I just need to tidy up things a bit before a release to the public.

·Layout

Automated executive summaries

I am starting to think that in the not too distant future, pretty much everyone will toss any piece of business writing into some sort of ChatGPT bot with the question “what does he/she actually want?”, instead of reading the actual text. Too many bullet points, too many long-winded emails, too many lazy writers… Let’s use AI to cut to the chase.

With that, some new sort of SEO (search engine optimization) will emerge. The bots are available to anyone, so you can predict what the bots will say about your text, so people might actually start optimizing/writing text that will trigger the right kind of output by the ChatGPT bot.

But maybe that can be automated as well…

·Data visualization

The little details

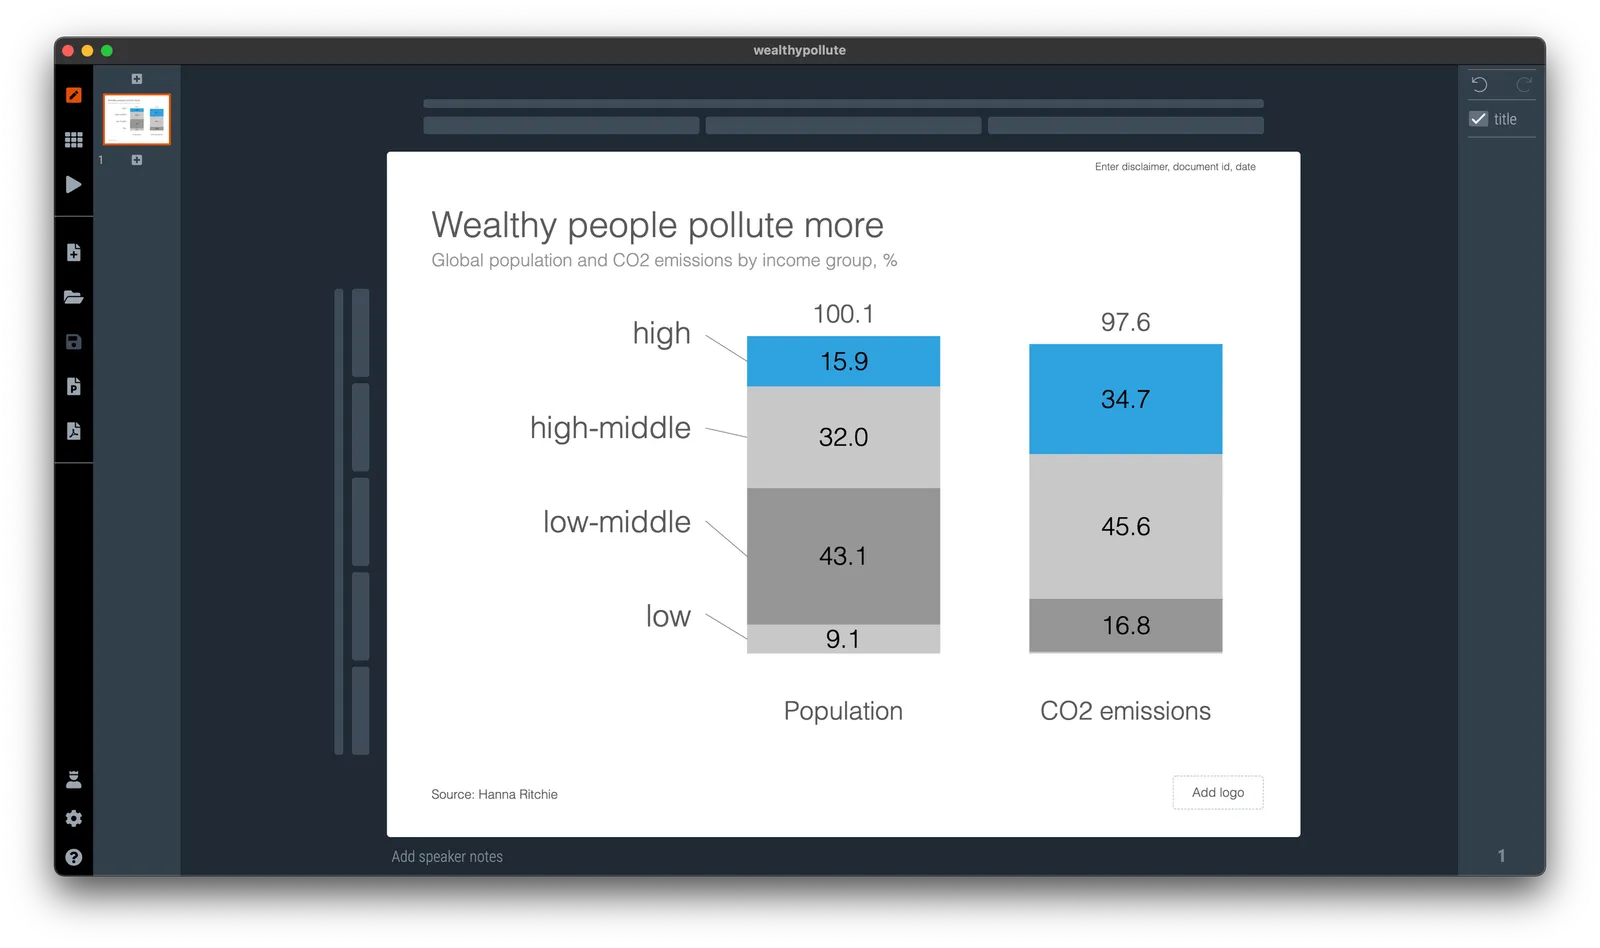
I was busy doing a chart makeover of the following chart:

To get to this result:

To found out that the columns don’t add up. In case of the left column, it is probably a small rounding error, but on the right, something got lost in translation.

About errors:

  • Don’t blame the spreadsheet, you are presenting a chart, not your backup model. If there is a rounding issue, fix it manually (I usually adjust the biggest category, so 43.1 would become 43.0 in this case). I always argue to disconnect your chart from the spreadsheet for your final document.
  • Even tiny mistakes can make people doubt all the numbers in your entire deck. Number charts should be simple, and it is a 5 minute investment to quickly check them on a calculator. Worth the investment!

In this case, the hidden calculation error shows the flaw in the type of chart chosen. The stacked column is more intuitive and shows how things are related. For the horizontal bar, I had to think for a second to understand what it means, and I did not instantly spot the error.

·Delivery

The wrong bucket

Last week’s conference is a gold mine for presentation pitch examples.

The receiver of a pitch of a new idea will almost always try to pigeon hole you in a product category they understand well, so it easy to compare the new thing you are offering to the familiar world they are living in.

We were pitching 9xchange that does not really fit very well in anything (yet). One of our audiences was someone in operations and IT. At the very basic level you can think of 9xchange as, well, an IT system. We have a web site, a server, etc. And this triggered all the red flags.

  • We currently have already IT implementation projects running
  • We already have a system that does […]
  • What, we just switched all our employees to system x
  • How do I get buy in from department x, y, and z for this, the previous project was a huge pain to get approved
  • We are behind schedule in rolling out this system

We did not even get to pitch the core idea behind 9xchange and got stuck in the hassle of running major IT integration projects in very large companies.

This prospect was the wrong person to pitch to, we did not even try.

·Delivery

The last day of meetings

More reflections on last week’s conference. We stayed 6 days, with probably an average of 8 - 10 meetings a day, plus 3 - 5 cocktail receptions each evening. That boils down to hundreds of pitches to hundreds of people, in a time zone that is 10 hours before yours.

Everyone is in the same boat (people who pitch, people at the receiving end of pitches)), and the dynamic of the meetings changes over the course of the conference. Towards the end of the event, people get really tired, and have seen the dance many times. The result: meetings actually get better. The small talk is about the shared experience of the conference. The setting is more informal. People are more flexible to meet outside stuffy hotel rooms, just somewhere in the corner of a hotel lobby. The pitch is much more direct (“ok, what do you want”), feedback is more candid.

But I am not sure there is a way to get to these last days of meetings without having to go through the first ones.

Image by Jeffrey at https://www.flickr.com/photos/48889052497@N01/11342817773

·Layout

Aligning logos in presentations

Getting logos to line up properly is one of the hardest things in slide design. I have not been able to come up with a set of rules to do it, every time I need to eye ball things to see whether things somehow look right. Below is an example from the 9xchange web site:

There are a number of (conflicting) inputs:

  • The middle of the image file
  • The typographical baseline of the text
  • The middle of the non-text part of the logo
  • Tag lines above or below the brand name

Always fine tune logo pages because any automated adjustment will for sure not get it right.