SlideMagic Blog

Frequent updates about all things presentations since 2008. Subscribe to never miss a post.

RSS
·Delivery

Aide memoire

The highschool teacher of my daughter handed out small cards to the class. Every student was allowed to fill it with whatever they feel like and take it to the upcoming test, or… sell it to the teacher for 3 points extra. The teacher’s sneaky strategy: making that card is actually 80% of the work of mastering the material for the test.

This is a bit like holding a small piece of paper in your hand during the wedding speech, or peaking at the speaker notes when doing a stand up presentation. In the world of Zoom, it can even be more blunt: lots of cheat sheets around your screen that nobody can see.

There are 2 ways to approach these cheat sheets:

  1. Write down the actual content that you want to remember, literally.
  2. Fill it with little hints that make you remember things.

The second strategy is more effective, it is easier to remember things, it takes less space (or time to look at your cheat monitor) and you will present things in a more natural way (reading out bullets from your speaker notes is even worse practice than reading them from your slide).

Maybe write “P.O.P.” or “pop” when the three words you need to remember start with a P, an O, and another P. This is similar to the strategy that memory champions use: put things you need to remember in an imaginary 3D space. (Number 42 sits under the pink elephant, next to the grand piano).

Continue reading →
·Software

What is wrong with this picture?

Zoom is introducing some “immersive” backgrounds to group video calls. A nice try, but something does not look completely right in this image:

It is very hard to get 3D photoshops right. If it does not look perfect, I recommend not even giving it a try in your presentation. It is like handing the pen to your 4 year old for one of your 30 slides. Instant loss of professionalism.

Why is it tricky for Zoom? Headshots are taking at different distances from the camera, and the camera position of the room is very high, in an environment with a very strong unnatural 3D distortion.

If I were Zoom, I would keep it simpler, with an artificial rendering of headshots, taking out their distracting backgrounds of bookshelves, kitchens and children’s toys, and paying careful attention to the relative size of the heads, position of the eye line.

·Data visualization

Order of data series

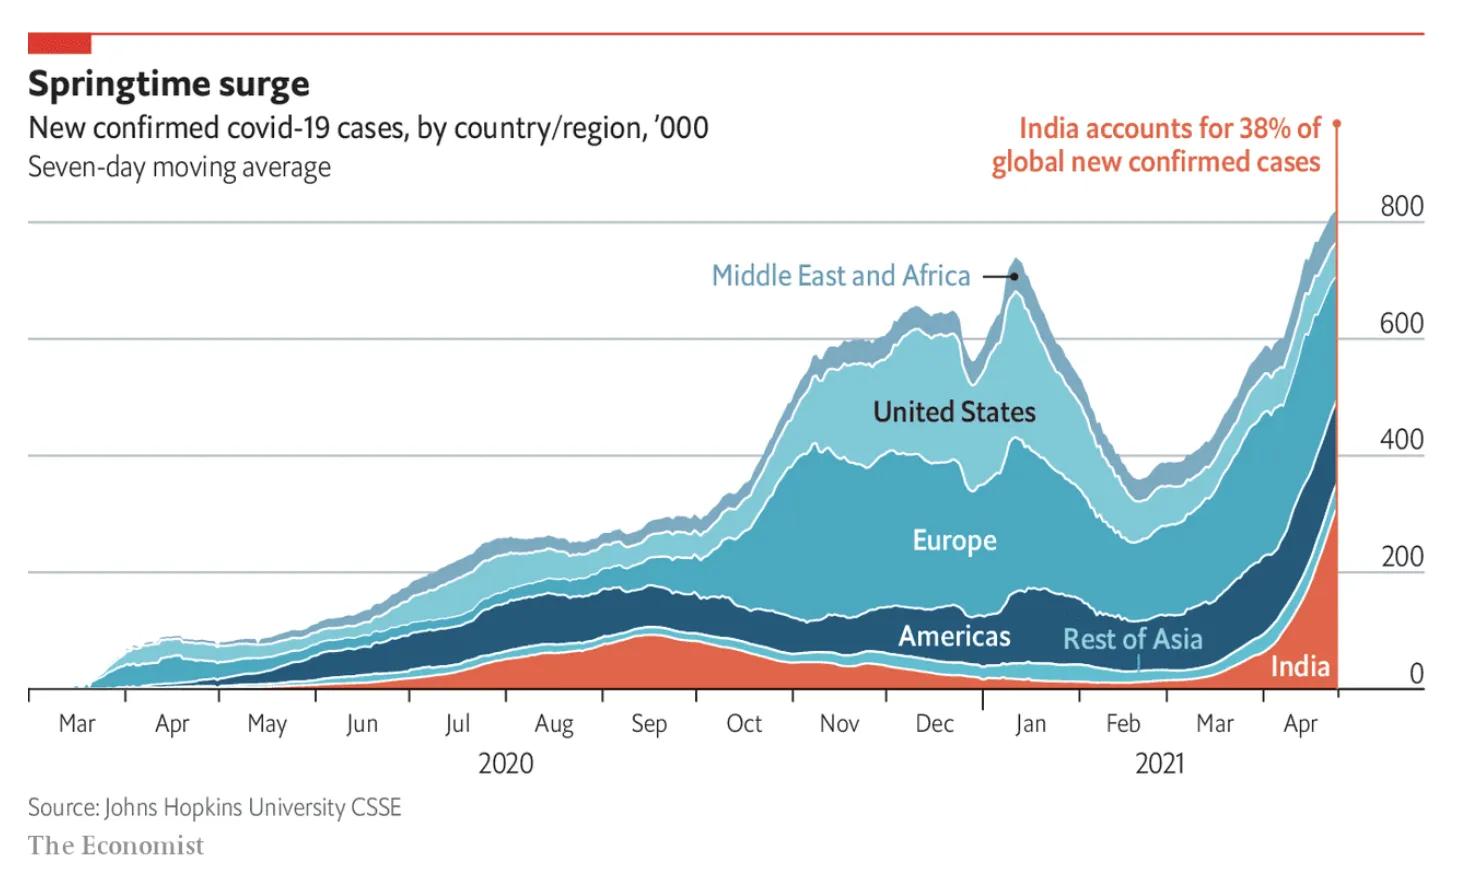
Here is a (sad) chart from today’s Economist:

The Economist put the data series that carries the main message of the chart at the bottom, pushing up all the other data series. My preferred option is the other way around, put it on top. In that way you can see all other regions staying pretty much stable, while India grows strongly.

(Unrelated). India has a very large population, and you need to look at COVID in that perspective. In terms of caseload, it is still behind other regions (such as Europe). The problem is the quality of the healthcare system, and the availability of basics such as oxygen in emergency rooms. Europe could handle the load (more or less), India is in a far worse position. Also, the India stats are averages for the entire country. On a region-by-region basis, there are likely to be places with much bigger caseloads than Europe. Let’s hope that it gets better.

·Concepts

Busy economics slide in SlideMagic

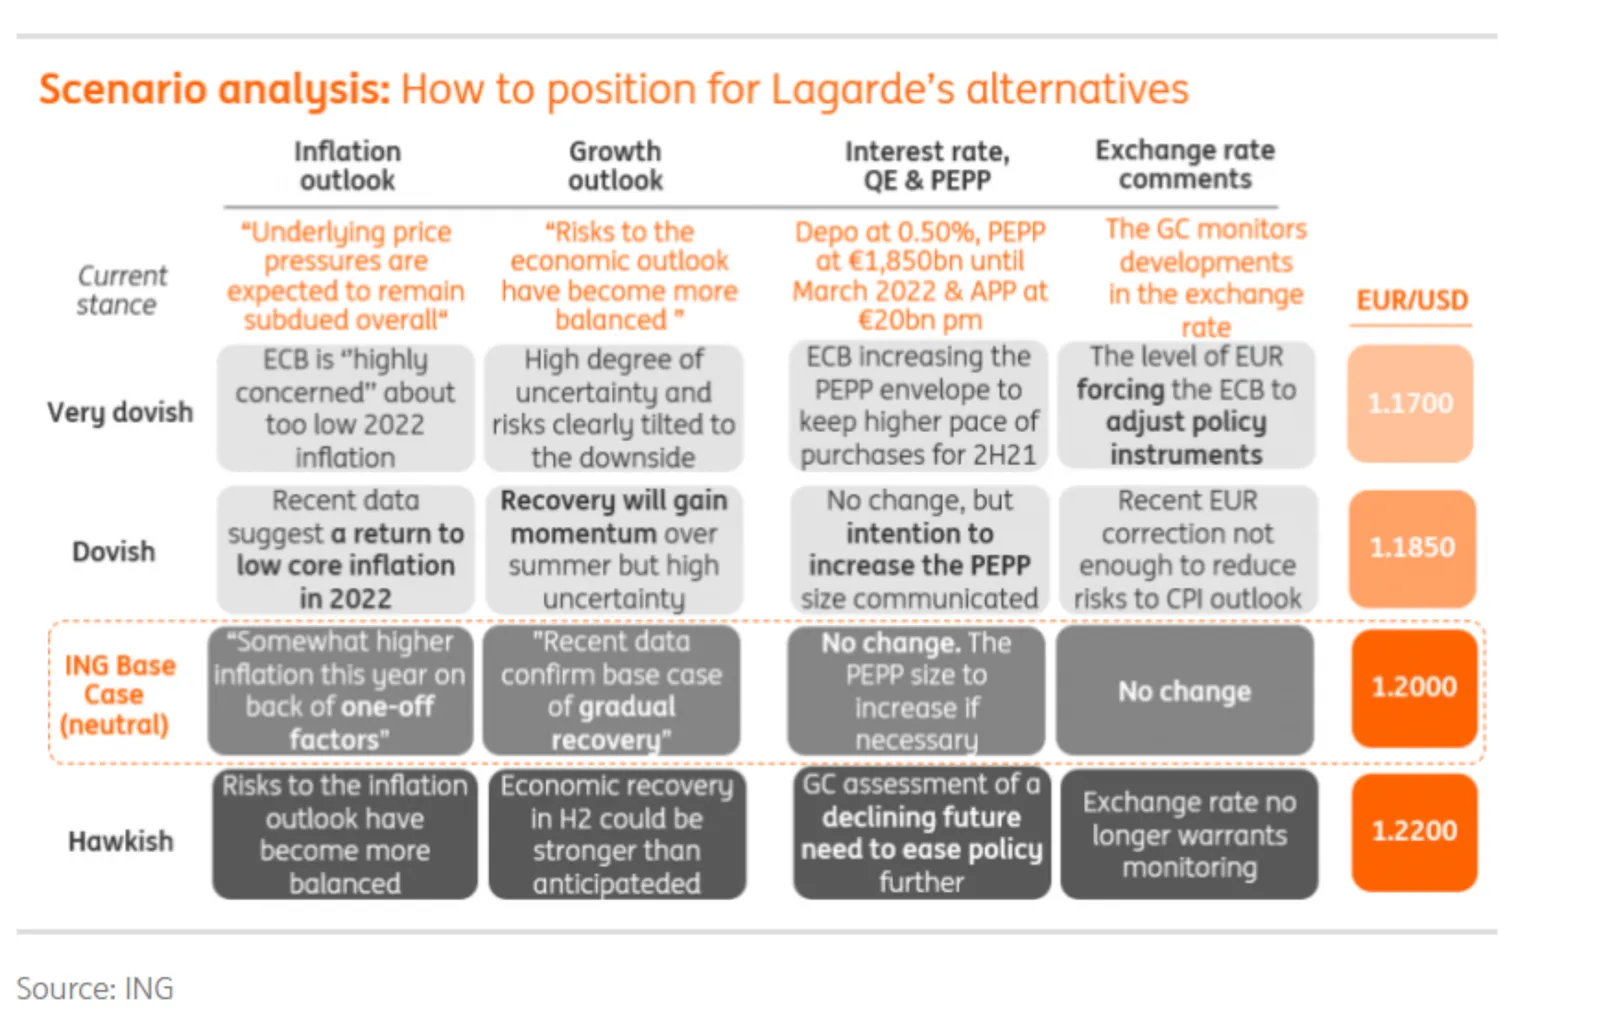
I stumbled on the slide below by @ING_economics.

This is a slide intended for reading, rather than serve as the backdrop for a TED Talk. It can be improved on a number of fronts:

  • Move the aspect ratio to 16 x 9 to make more space for text in the boxes
  • Actually reduce the font size (we are reading anyway), to make the text fit better in the boxes, with more white space, and less irregular sentence wrapping
  • Make the rounded edges less extreme
  • Make the dark colour accents a bit less strong
  • And most importantly, fix those misalignments that make me cringe…

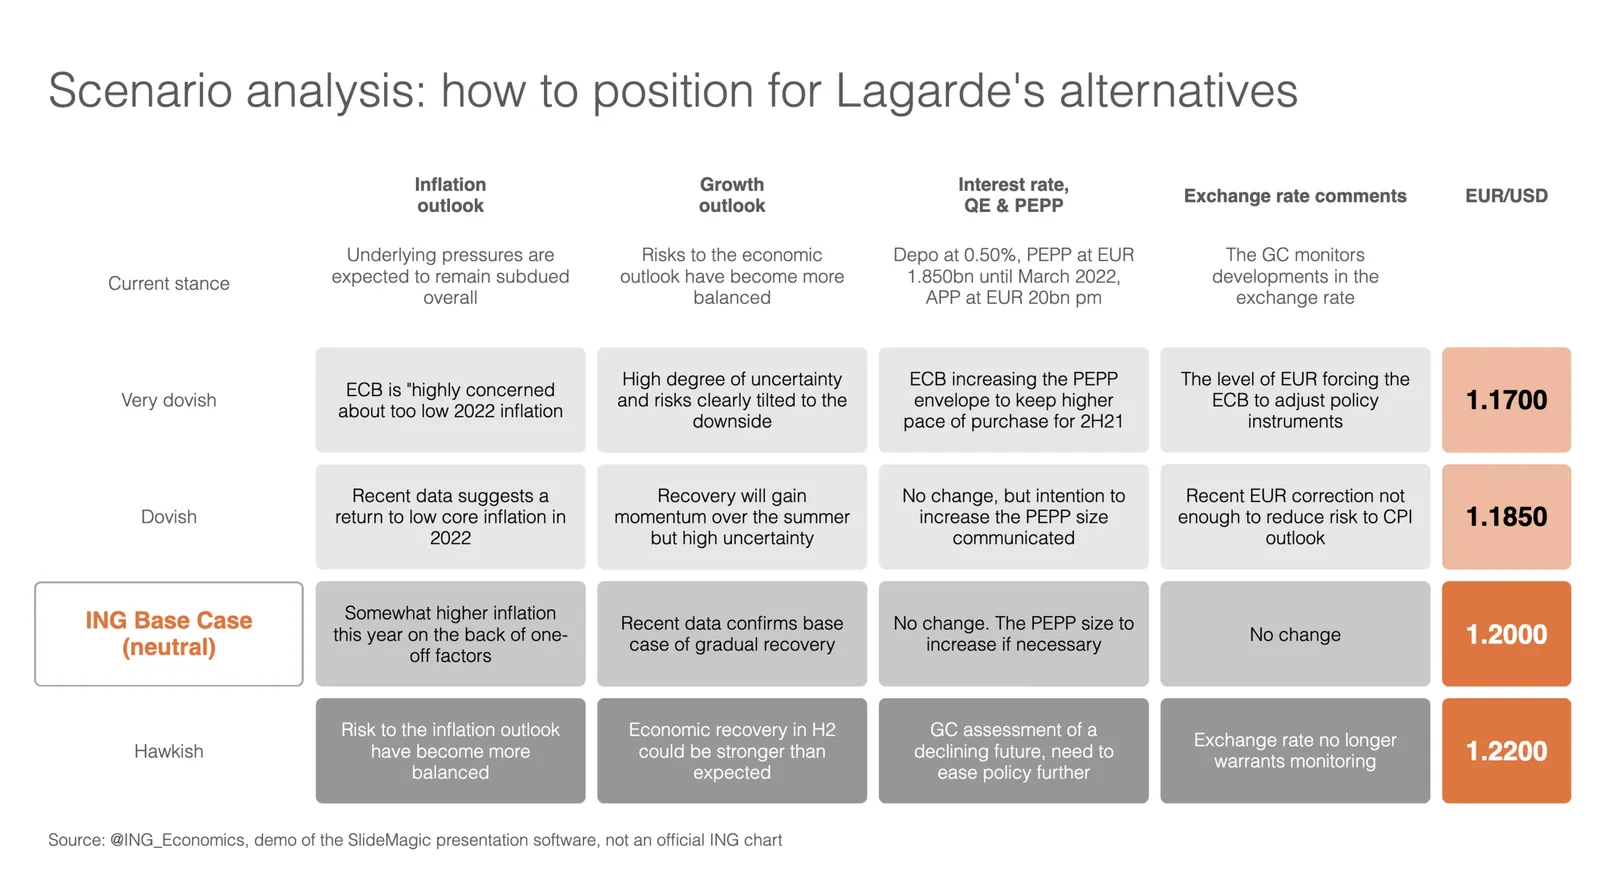
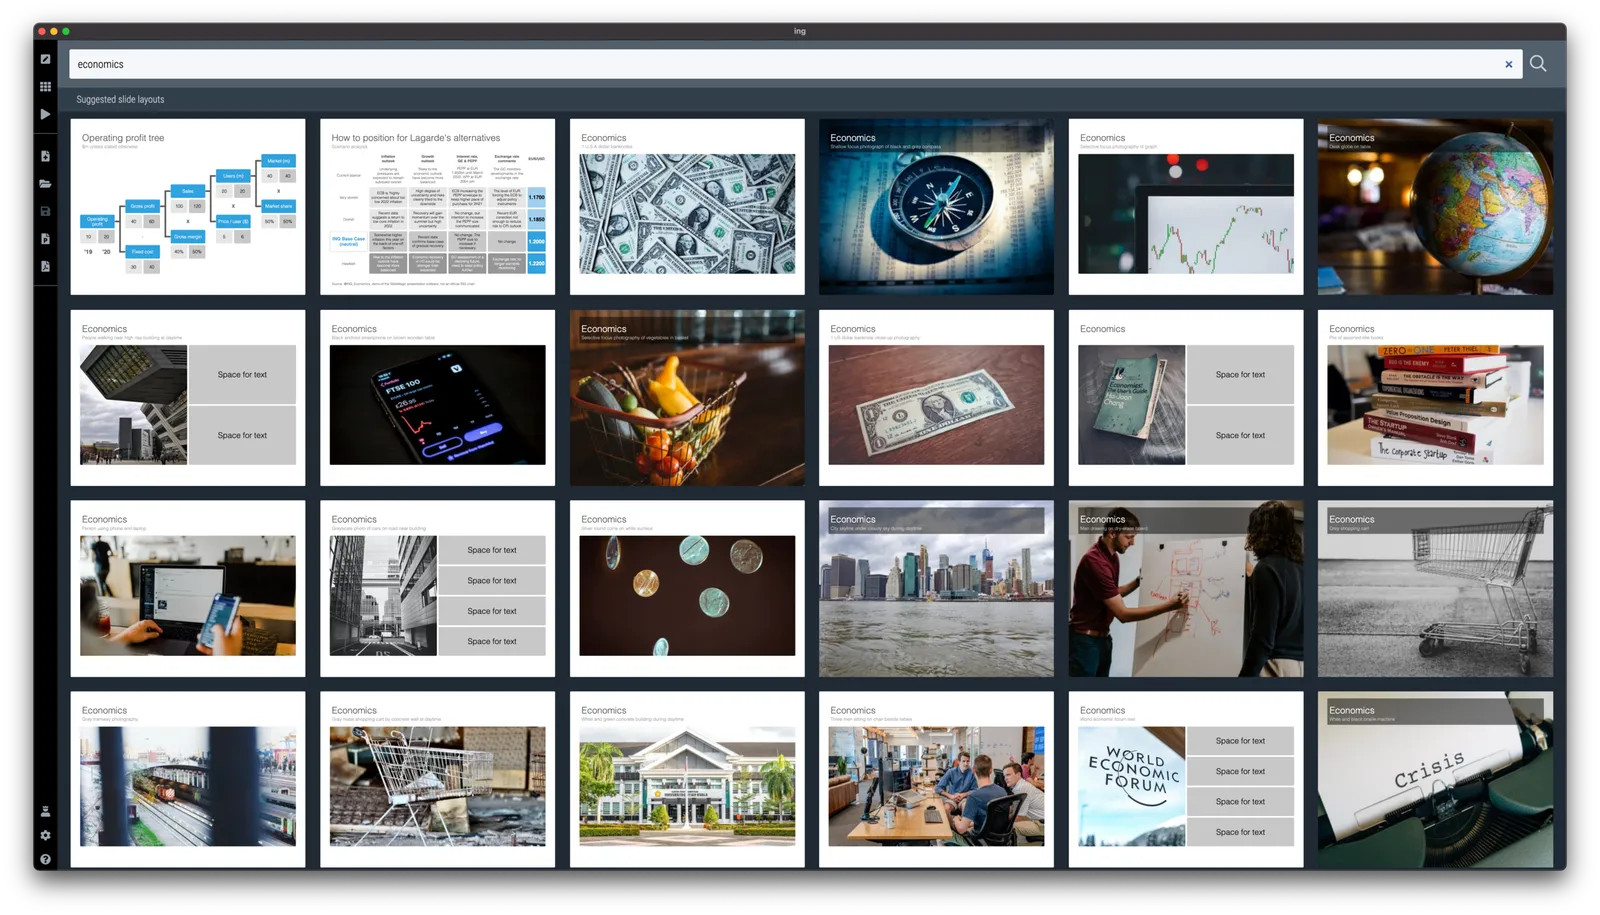
I did a quick re-do in SlideMagic, with is particularly powerful when it comes to text tables. I added the slide to the SlideMagic library, search for “economics” in the desktop and it will show up.

·Delivery

Apple event - "auditorium camera position"

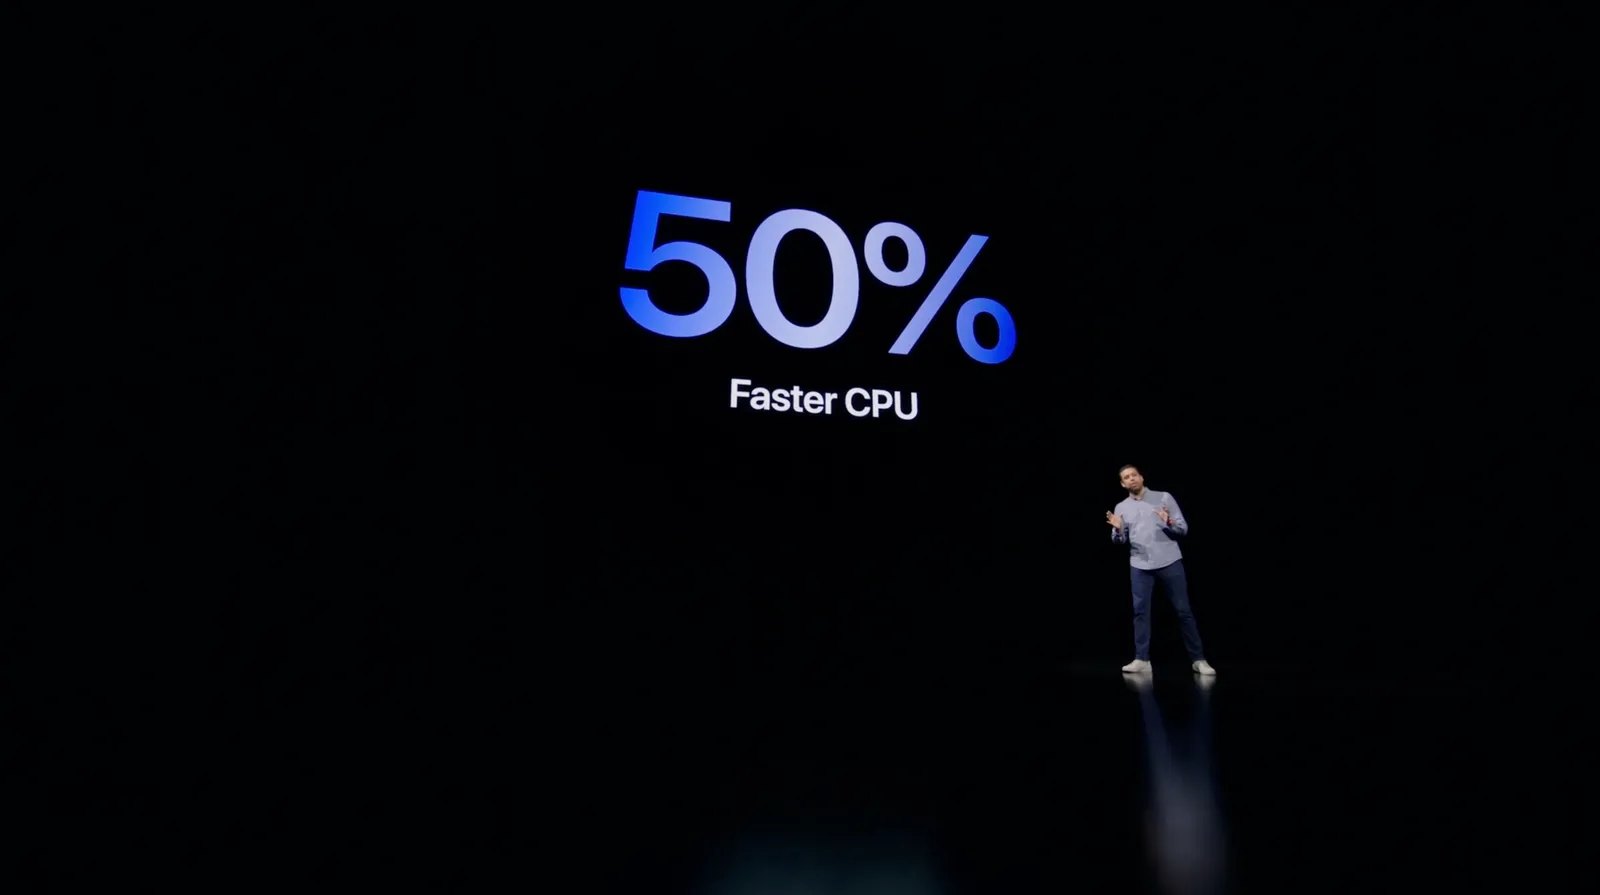
Apple is known for setting the standard when it comes to product presentations. It is interesting to see what they produced in yesterday’s event within the constraints of COVID. A pre-recorded, pre-produced long-format “television commercial” without a live audience.

As we know from Zoom calls, webinars-style presentation of slides with a presenter voice over can be pretty boring. Adding a small picture-in-picture video of the presenter makes things a little bit more interesting, but it still does not capture the energy of a live presentation.

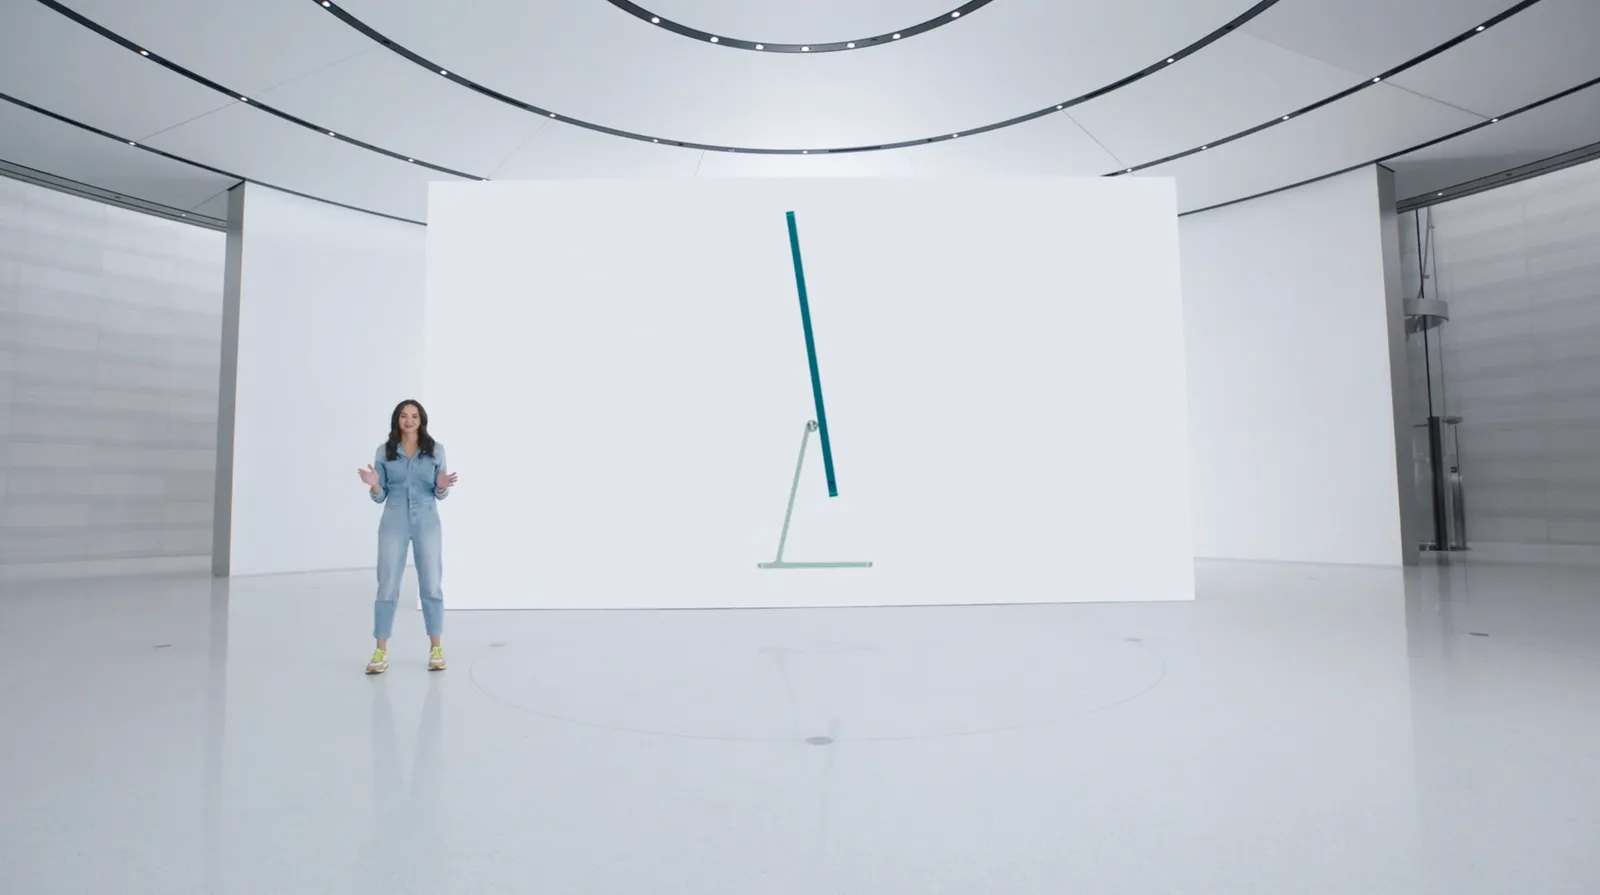
Apple used an auditorium-style camera position in some of the presentations:

This enables the speaker to walk around, to create a much more interesting presentation. Big budget, multiple camera editing completed the effort.

This is something you could copy, if your business has a large neutral wall, record yourself event without slides in the background, peeking at a small presenter laptop, and later on edit the slides in the background. Or if you have an amphitheater around (if you are a university student), you are lucky and can use that.

I guess this could also be a good idea for some future startup, that maybe can record you in a much smaller setting, and add the digitally created auditorium in a later stage. I see Prezi moving in the direction of video now, but it tries to make the slides more dynamic and exciting. I think this opposite approach is more effective: very calm slides with an energetic presenter.

·Layout

Slide layouts and aspect ratio

The aspect ratio of a slide influences the type of layout you come up with. Over the years, presentation slide aspect ratio tend to follow the dimensions of computer screens. The first computers typically had a 4x3 screen ratio (80 x 25 characters of a punch card, sort of resembling an A4/letter format, and probably easier to design when you need to redirect electromagnetic beams in pre-LCD traditional televisions/monitors), while modern machines have wide screens in 16 x 9 ratios (the preferred format in movies).

A 4x3 canvas is very different from a 16x9 canvas when it comes to design (spoiler, I prefer the 4x3).

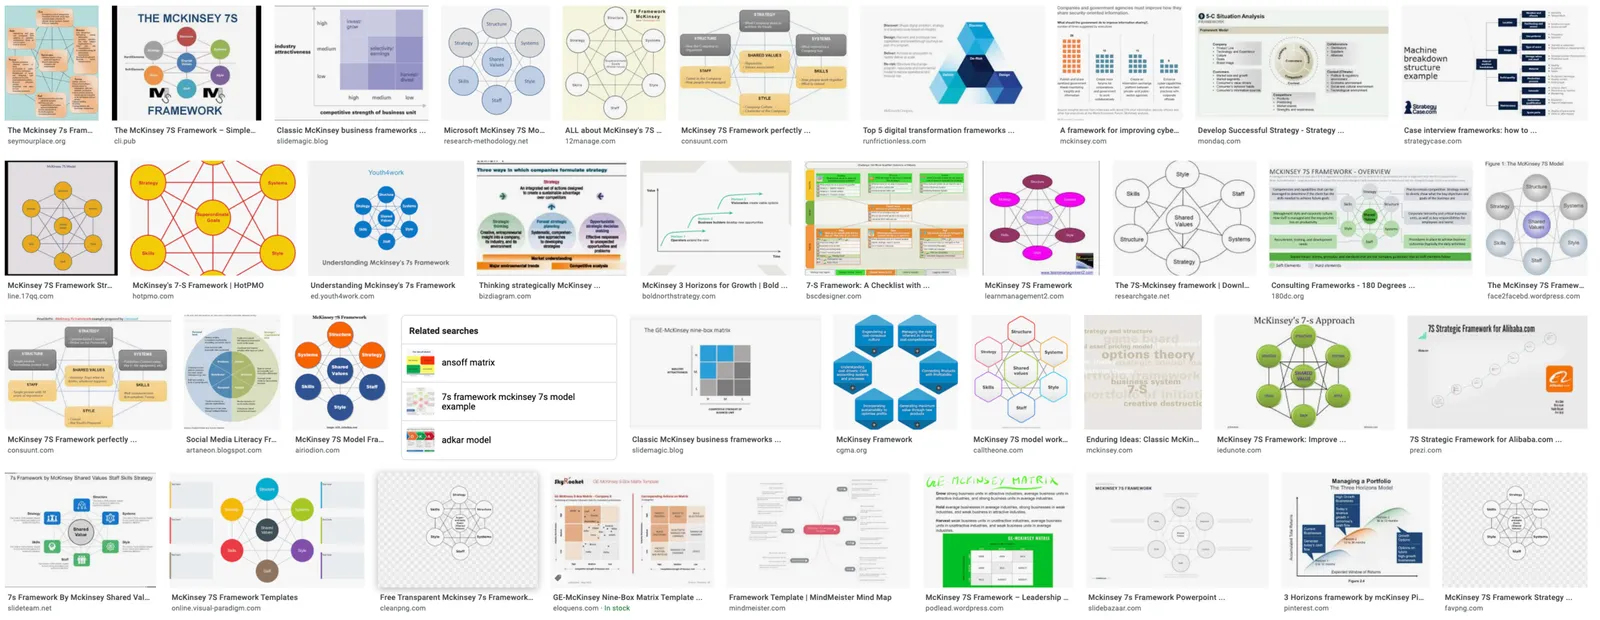
Most diagrams and frameworks work best when width and height are about the same. When you look at many of the classical management consulting frameworks, you can see that they were originally designed in a 4x3 aspect ratio. Modern interpretations simply stretch them out, making the whole thing look unbalanced.

Process diagrams and tables on the other hand, work great in widescreen format. There is a lot of space for left-to-right steps or columns with information.

What to do?

  • There is nothing wrong with white space. If your diagram needs a 1x1 aspect ratio, put it in the middle of your 16x9 slide and resist the temptation to fill the left and right sides with text or other distracting clutter
  • Alternatively, consider putting the titles of your slide on the side, creating a mover vertical canvas for the body of your slide (SlideMagic can switch seamlessly between different slide title layouts).
Continue reading →
·Concepts

CMMI template

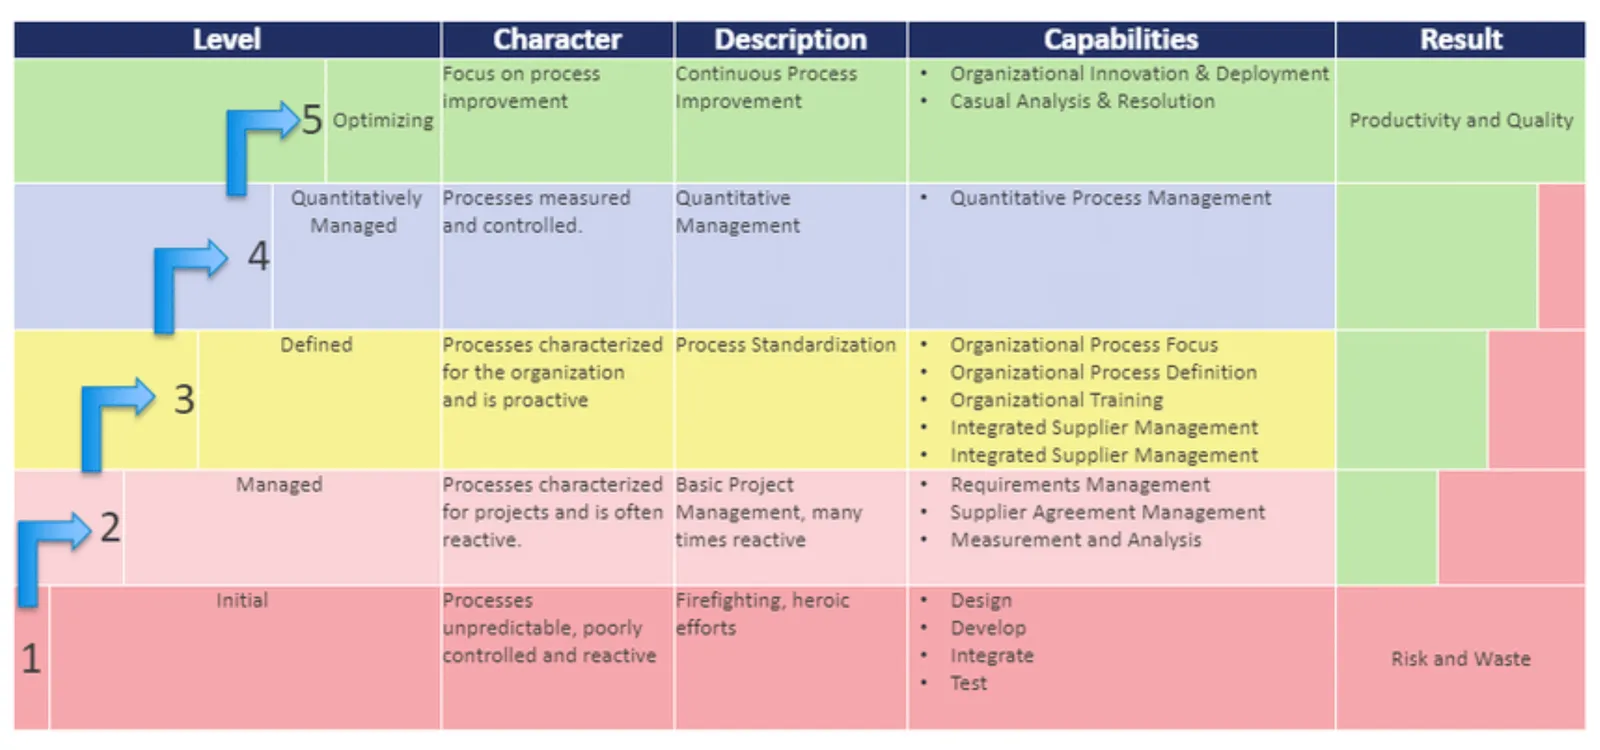
One of the users requested a template for the Capability Maturity Model Integration framework (more information on the site of ISACA’s CMMI Institute).

I worked of the following original (not created by CMMI):

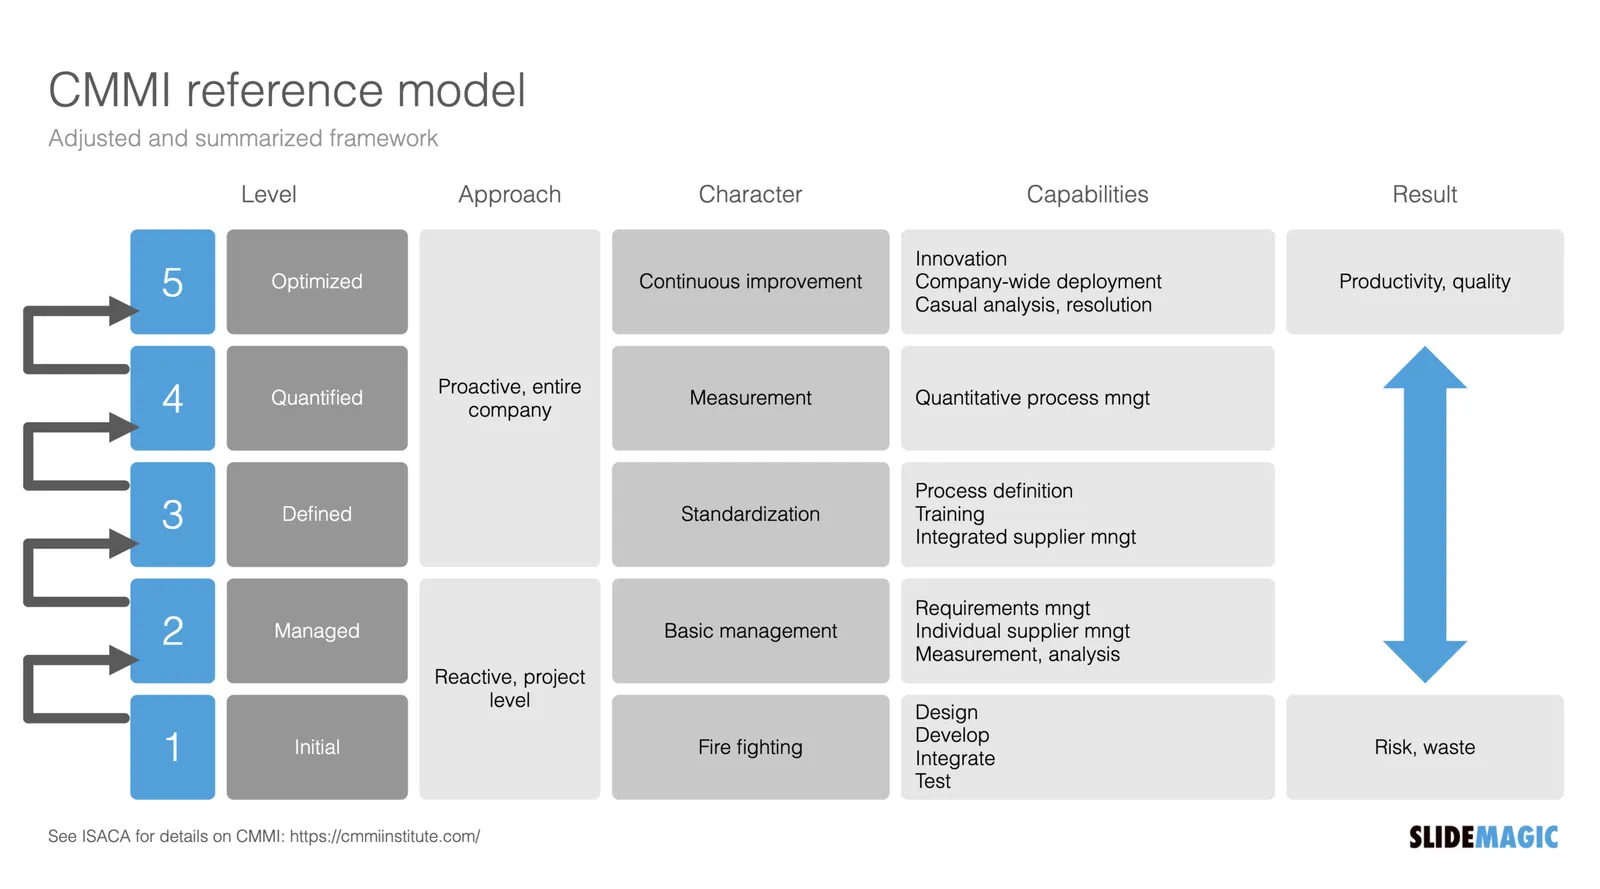
Next to the general layout, there is also a lot of improvement possible in the text. Overlaps, and jargon can be removed. Here is the template that I added to SlideMagic, search for “CMMI” and it will pop up in the SlideMagic app.

This is my interpretation of the framework, and not endorsed by the Institute. But this reflects how I think you should treat all these diagrams by consulting firms, academics, and business schools: use and adapt them for your own situation. If the jargon does not make sense for you, take it out.

·Data visualization

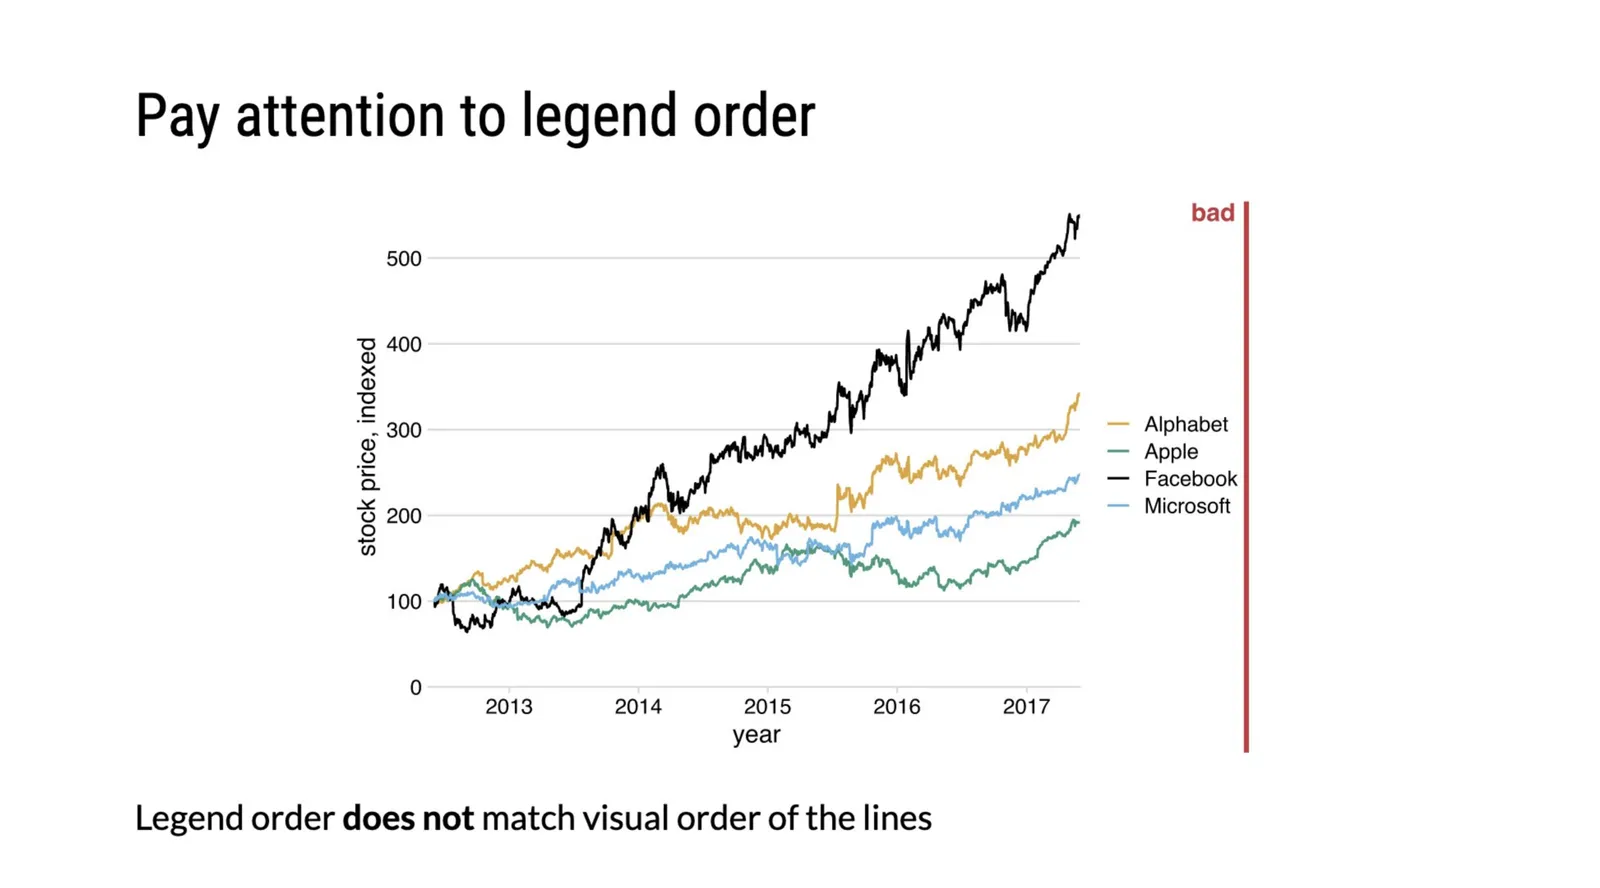
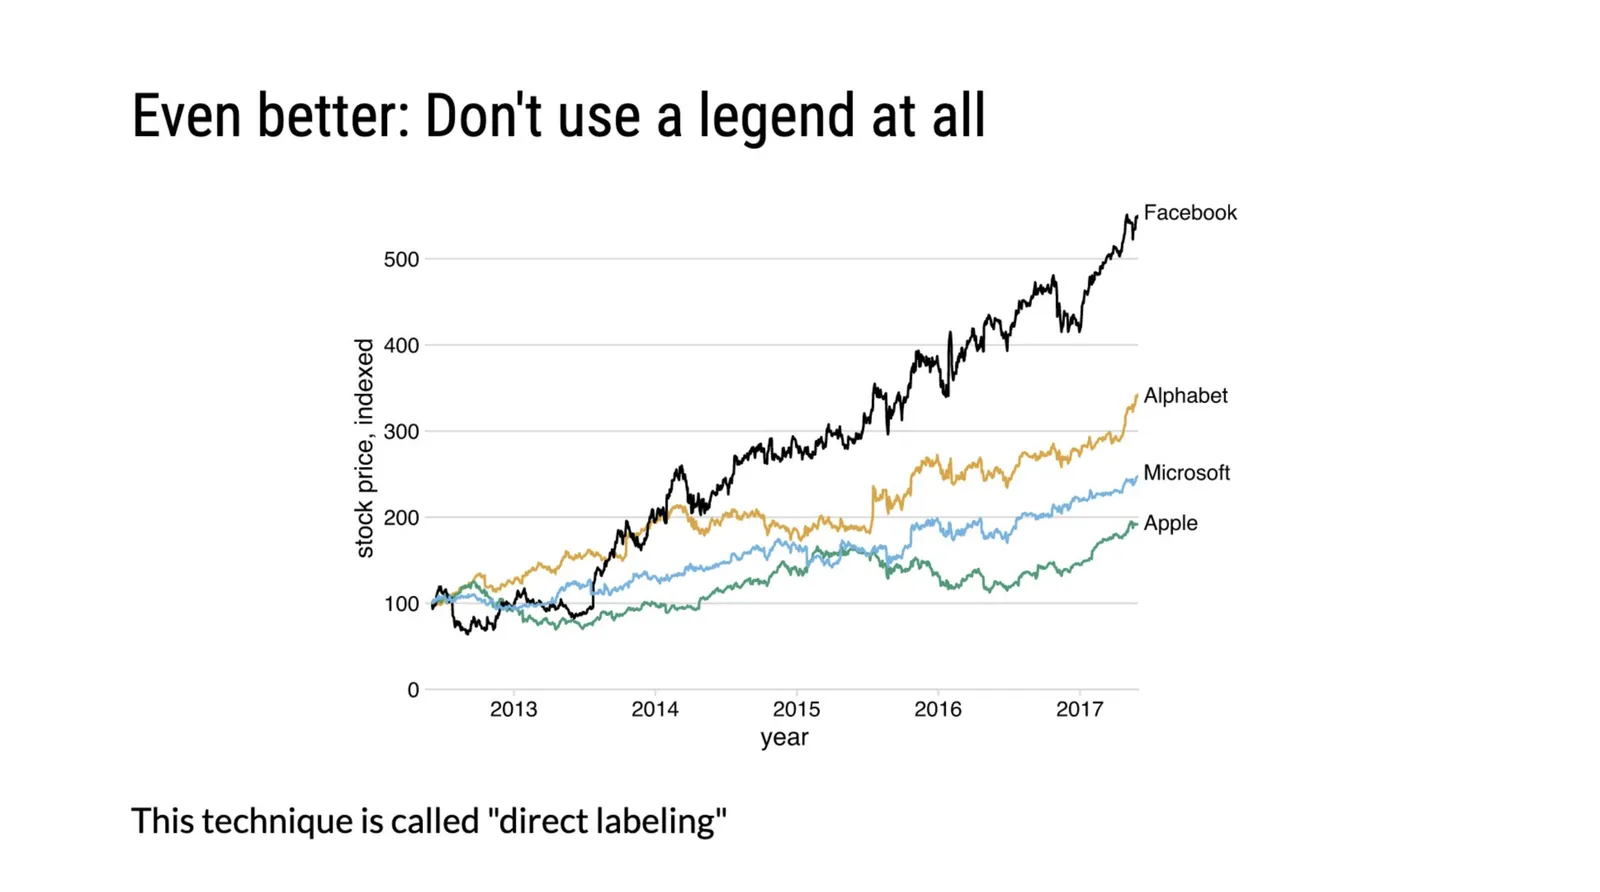
Legends can be confusing

Some perspectives by @clauswilke:

He is right. Legends can be confusing and are prone to errors, when possible, put the data label immediately next to the line.

·Culture

Communication culture

Most presentations are not IPO roadshows or TED Talks, so it does not make sense to invest a lot of time and money in them (i.e., hiring expensive designers). But that does not mean that they need to look horrible and boring.

If almost all the documents a company’s employees work with are hacked together, poorly structured, boring lists of bullet points, you start eroding the place’s culture. The energy of a meeting is zapped by a quick glance of the PowerPoint slide sorter (“oh no, 90 minutes of this coming up”). Young trainees learn that this is the standard they should aspire to. At the same level of office supplies running out, poor cleaning, crappy laptops, cheap coffee. Everything points to the work environment where it is OK to cut corners, and only give things your best when you leave the place in the evening. Eventually, it will impact presentations and documents for an external audience as well.

The idea behind SlideMagic is that these every-day presentations can still look organised, fresh, and inviting without a big investment.

Photo by Adrian Curiel on Unsplash

·Creativity

Forget about folders

Filing and categorisation systems are a pain. It is tedious to put things in the right folder on your hard drive, put the data of a file in year, month, day format to make them sort, and final versions always become final final, final final final, really final v2. Google replaced Yahoo’s internet categorisation with search.

Back in the 1990s there was a Partner in McKinsey’s London office who gave up on filing (mostly paper at that time) and simply shoved everything chronologically in his cupboard, all clients mixed. Finding something was as simple as looking into your calendar and going back to the appropriate time. Usually, you roughly remember. It takes a tiny bit longer to find something, but save a ton of time doing, and nothing falls through the cracks because of a misplacement.

The same strategy might also work for your digital files in 2021. Your calendar becomes the index to dig something up from the “pile”.

Photo by Viktor Talashuk on Unsplash