SlideMagic Blog

Frequent updates about all things presentations since 2008. Subscribe to never miss a post.

RSS
all posts

Category Presentation design

·Data visualization

Data chart consistency

There are many options to format a data chart: write million or m, put percentages in columns or not, a thin baseline or a fat baseline or no baseline at all, tick marks or not, grid lines or not grid lines, drop shadows or flat, you can go on and on.

Whatever you choose, choose the same preferences on every page so your presentation will look consistent.

·Data visualization

Infographics that try too hard

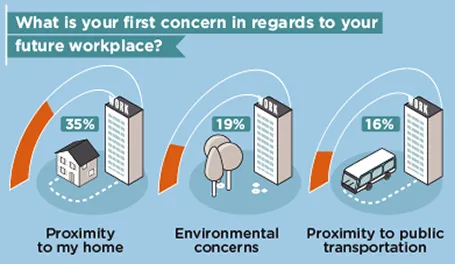
Many (maybe even most) infographics focus primarily on a cute visual concept and forget about the data they need to communicate. The result: pretty pictures that are impossible to understand.

First, focus on the data and think what you want to show: a trend, a comparison, a ranking, a contrast. That should be the basis for the design of your graphic.

Then, remember that cute icons can be as hard to understand as a bullet point: sometimes it can be more effective to write down the words “home” and “work” than trying to come up with illustrations of a house and an office.

Clients often request a cool infographic to get their message across. My response is to stuck to a more traditional presentation format, but if they insist on an infographic look, to go more creative on colors, shapes, and especially fonts at the expense of technical compatibility and the ability of everyone in your organisation to edit the slides for their own needs.

The WTF Visualizations blog is full of bad infographics, enjoy! (Via Daria)

·Colors

iOS7 and PowerPoint templates

Most PowerPoint template designers think that what you put on the empty template page sets the look and feel of the presentation. Gradients, watermarks, logos, color bands. I have long been arguing that the template can just be a blank white page, what sets the look and feel is your approach to how your design the slides: what shapes, what colors.

The new iOS7 is a good example. Icons that looked great in iOS6 now look dated instantly in iOS7. The design philosophy has changed, without new logos, or repeated graphical elements on the page. It is the combined power of the new iOS7-ready icons that together create that new fresh layout.

So in PowerPoint, pick your colors, your fonts, your approach to shadows and gradients and you can use a simple blank page as your PowerPoint template.

·Keynote

Explaining big data

Many of my clients are now in “big data” and need to explain why what they do is so clever.

One approach to do this is the mathematical research paper approach: describe the algorithms and point out on what data sets they work.

A much better one is the take one practical case example throughout your entire presentation. Show how you searched millions of health records, cross matched them with facebook location data down to the square kilometer, overlayed that with climate data for the past 300 years and came to this very targeted, very unexpected insight that you would never have found out using a Google search, buying a research report, or other 2 common search methods.

The scientist will like approach number one: no ambiguity and a perfect explanation. The rest of us will prefer option two.

·Investor presentation

Amateurish format or no format?

It requires some skill to get a presentation to look professional. And when you are a boot strapping startup, I think most investors will forgive you if you did not have time or money to get your investor slides look completely perfect. You decided to put your effort elsewhere, rather than spending it on PowerPoint looks.

So, the bare PowerPoint template with a tiny logo on the bottom right looks, well, bare, but you could still say it is professional, sort of. Worse is when you put in a lot of effort and the results do not look good:

  1. Clashing colours
  2. Too childish, or too cute for predominantly machine/male investors
  3. Tacky, cheesy stock images
  4. Super complex gradients and other template graphics that take over 50% of the slide surface

No format works for an early stage startup investor pitch with a good idea, it will not work in a sales presentation though.

·Keynote

The ponder slide

Not all PowerPoint presentations are in front of 500-seat TED audiences. Many presentations get emailed around and read on screens.

Strategic decisions are usually a careful trade-off between options. Some choices are clear, fact-based and objective. Others are qualitative, and yet others are complete leaps in the dark.

To make a decision you need to have all of the factors on some page somehow. Yes, this dense slide violates all the rules about good presentation design. But there is one big difference: the audience that will appreciate it are insiders, who suffer from the Benefit of Knowledge (the opposite of the Curse of Knowledge [what?]). They have heard the arguments before and they are ready for decision time.

How to design a good decision slide for these people?

  1. A table: options in the columns, arguments in the rows
  2. Group the options and arguments somehow, sort options by risk, how radical they are, something. Group arguments: similar arguments go together, if they are sort of the same thing, you collapse them into one. Group the factual arguments, to make the more contested ones stand out.
  3. Label your options and arguments for the audience with the Benefit of Knowledge, short labels or placeholders that are enough for them to understand the full picture. After months of discussions “Blink first” might be enough to describe a strategic scenario covering 25 pages.
  4. Frame the options so that the answers are in the same direction: I usually pick positive ones: no cannibalisation, retention of talent, limited competitive threat. Etc.
  5. Now the tricky bit: score options (1, 2, 3, low, medium, high) and use colours to distinctive good or bad. Re-group, re-sort options and arguments until you get the maximum number of continuous good and bad fields.
  6. Look at the result and tweak scores and weights until you reach your conclusion. If you had the push up the weight of the leap-of-faith type of arguments a lot to balance the factual criteria, you know what you will have to explain in your presentation
  7. Once you reach your conclusion you can make a hugely simplified version of this matrix, collapsing all similar arguments together and boiling it down to the 2 or 3 points that will tip the balance
·Keynote

Substance first

So, you have been assigned the responsibility to get 15 senior business unit leaders all over the world to produce one coherent company strategy presentation in 2 months. Your role is just process, you are a relatively junior executive in the organisation, and the only leverage you have is backup by your CEO. A dream assignment…

It is tempting to try to make it as easy as possible by creating standard presentation structures, standard colour templates for everybody to follow. On top of that you could force deadlines on everybody to write down the key messages of the presentation first, ahead of the actual slides. You can write all this down in a beautiful Gantt chart.

In theory, this all makes sense. In practice though, I see that people only really start to focus when the actual content of the story is produced. So, here is an alternative and slightly more messy approach.

Start with the substance. Have each business unit Frankenstein together a deck of existing slides, and use that first presentation as a basis for a discussion what the business unit actually wants to say. What matters here is the sound track, the verbal story, not the actual slides. You need a trigger for them to start talking to you.

Second, try to get a fellow junior executive in every business unit who takes ownership of the presentation. This person will be easier to access and more skilled in PowerPoint than the business unit leader.

Now, start working with your 15 colleagues on getting to a uniform presentation. Create the common PowerPoint template and sketch out the structure of a business unit-specific deck based on the verbal briefing you had. Give home work to your 15 colleagues and follow up with frequent progress reviews. Create some competition by putting up draft presentations for everyone to read throughout the 2 months progress.


Continue reading →
·Keynote

The new Yahoo! logo

Marissa Mayer “Geeked out” on a new Yahoo! logo in a weekend (pretty much the same way in which the gmail logo was created) and designer Oliver Reichenstein rants about how she violated every best practice of corporate branding.

I am somewhat in the middle between the 2 extreme viewpoints. What Marissa did, was not a major rebranding of the company, she fine tuned the existing logo. I think it actually looks better than the old one, but - to Oliver&rsqo;s point - the Yahoo! brand has not changed for me. Marissa is only showing that she is making an effort to change things.

On the other hand I do find that big corporate branding projects often have a “the emperor has no clothes” feel to it. A company’ brand is more defined by what a company actually does: what product it delivers, and how she interacts with customers. Fluffy marketing slogans and long brainstorm sessions about logo personalities do not change much.

You could say that the Curse of Knowledge also applies to multi-million dollar logo redesign projects: for the people who were part of the design process and sat through all the workshops, it is perfectly clear that small green oval (no, not a circle) at the top right symbolises openness. For everyone else, it has no meaning. In that respect, many logo design projects are similar to mission statement crafting projects.

I guess there is a difference for companies with different logo audiences. If you are a big holding company, your corporate logo probably only speaks to 500 investment analysts. If you are a big retailer that needs to stand out in a busy high street full of visual clutter, your logo all of a sudden becomes a lot more important.

Continue reading →
·Keynote

Business English

I left the Netherlands in 1994 and have since then worked in international environments where English is the business language. And business English is different from regular English: it has a very small vocabulary. Why? Many non-native speakers have to speak it, and you actually do not need a very rich vocabulary to get the basic business concepts across.

Now and then I come across business communications from the Netherlands and am surprised to see how the English language is invading the Dutch business language as well. I am not a big fan. You either write in English, or in Dutch. While I would not go as far as the French and insist on inventing new native words for English concepts (Internet browser?), I think it is a bit strange to see a Dutch sentence with 25% English words in it. Even if you did not intend to, the English words contribute to a feel of fluffy buzzword abuse.

For a presentation, the safest solution is to write the document in 100% English, so you can use it for every audience and change the language in which you present depending on your audience.

·Investor presentation

Investor pitches evolve

As your company evolves, so will your investor pitch. At the idea stage, you are mainly concerned with explaining your idea and establishing you as a credible entrepreneur.

But with a product up and running, a few customers, and some revenues, investors will turn to other things like customer acquisition cost, churn, customer close rates, whatever is relevant for your industry. Inevitably, your deck will become less creative and resemble more a standard business presentation full of numbers and data.

Do not use the pitch deck from last year for your next investor meeting.