SlideMagic Blog

Frequent updates about all things presentations since 2008. Subscribe to never miss a post.

RSS
·Investor presentation

Fixing investor pitches

Each investor pitch project is different, each requiring upgrades in specific areas. Here is a list of what I typically encounter. Usually a client did a few right, but needs help in a few others.

  • Too PowerPoint: all the standard colours, fonts, etc.
  • 1990: clip arty or 2005: cheesy stock images
  • Too TED: so minimalist that it is impossible to understand what the company is actually doing
  • Missing business case (revenue model, etc)
  • Grand opening full of obvious facts that takes forever before turning attention to the company itself
  • The company does not explain why what they do is so hard, clever, original
  • Bullet point overload (but I see less and less of this)
  • Not addressing the elephant in the room, the obvious big question that is screaming out to be answered
  • Not enough “meat” to show that there is real science, technology, substance here
  • Visual analogies are too complicated to understand
  • Excel data dumps straight into PowerPoint
  • Too many benefits, as a result the audience perceives: “no benefit”
  • Unfocused feature expansion list: “and we will this, and we will do this, and we will do this”
  • Too much design: icons, cute fonts, Adobe Illustrator shapes mixed with PowerPoint
·Story

Anticipating the next question

We all understand that story telling is a better way to get an idea across than reading out bullet point after bullet point. Still, most presentations happen in a business context. And in business, people do not have the patience a movie audience has (15 versus 90 minutes).

One approach I use to plan a story flow for a business presentation is anticipating the next question of a smart audience. Each pitch, each situation, each industry, each vertical, each country, each type of meeting has their own sequence of questions:

  • What is it they actually do?
  • Will it work?
  • Why is this a big deal?
  • Why has this not been done before?
  • Can they pull it of?
  • Can people game the system?
  • Will anyone sign up for this?
  • What happens if Google enters the market tomorrow?
  • Can they make money?
  • Will people pay for this?
  • Can they sell it?
  • Are they focused enough?
  • How financially stable are these guys?
  • Do I like these people?
  • What is the accent?
  • When is lunch?
  • Do they have data to prove it?
  • Why did no one else invest?
  • Isn’t this exactly the same as the idea I heard last week?
  • How can a 25 year old make this happen?
  • Can it scale?
  • Will the government agree to this?
  • What if a “Black Swan” event happens?
  • Why is she not answering my question?
Continue reading →
·Typography

Letter spacing in PowerPoint

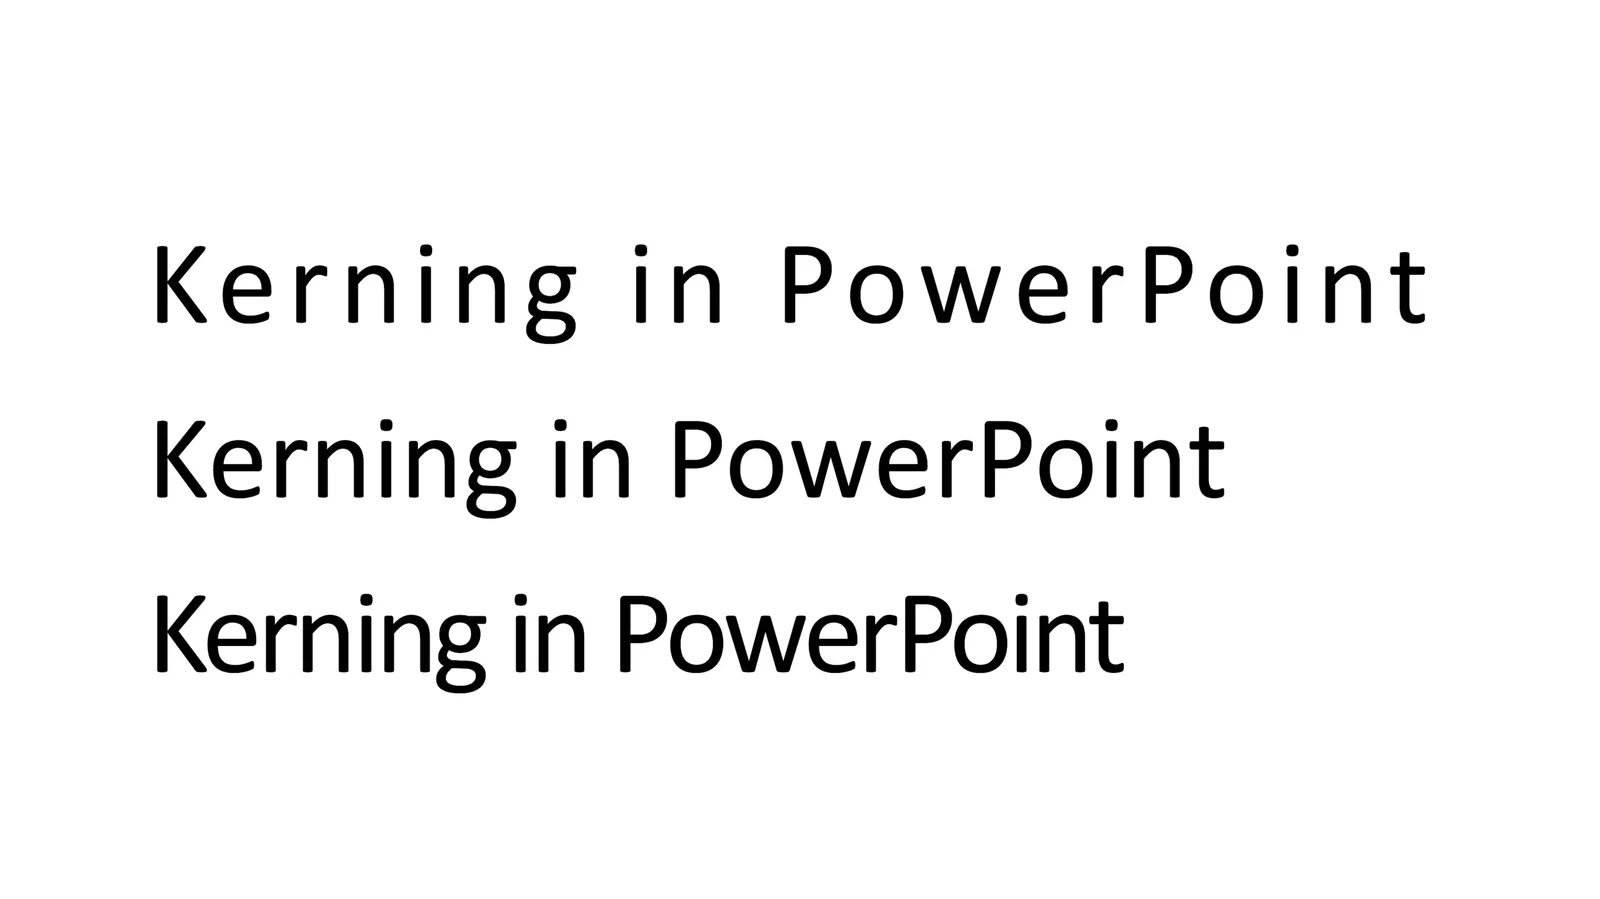
Kerning” is tweaking the spacing between characters in a word. Not to be confused with line spacing, tweaking the vertical space between lines.

Line spacing is important in presentation design. When you use very large font sizes, PowerPoint adds too much wide in between lines, you need to trim it.

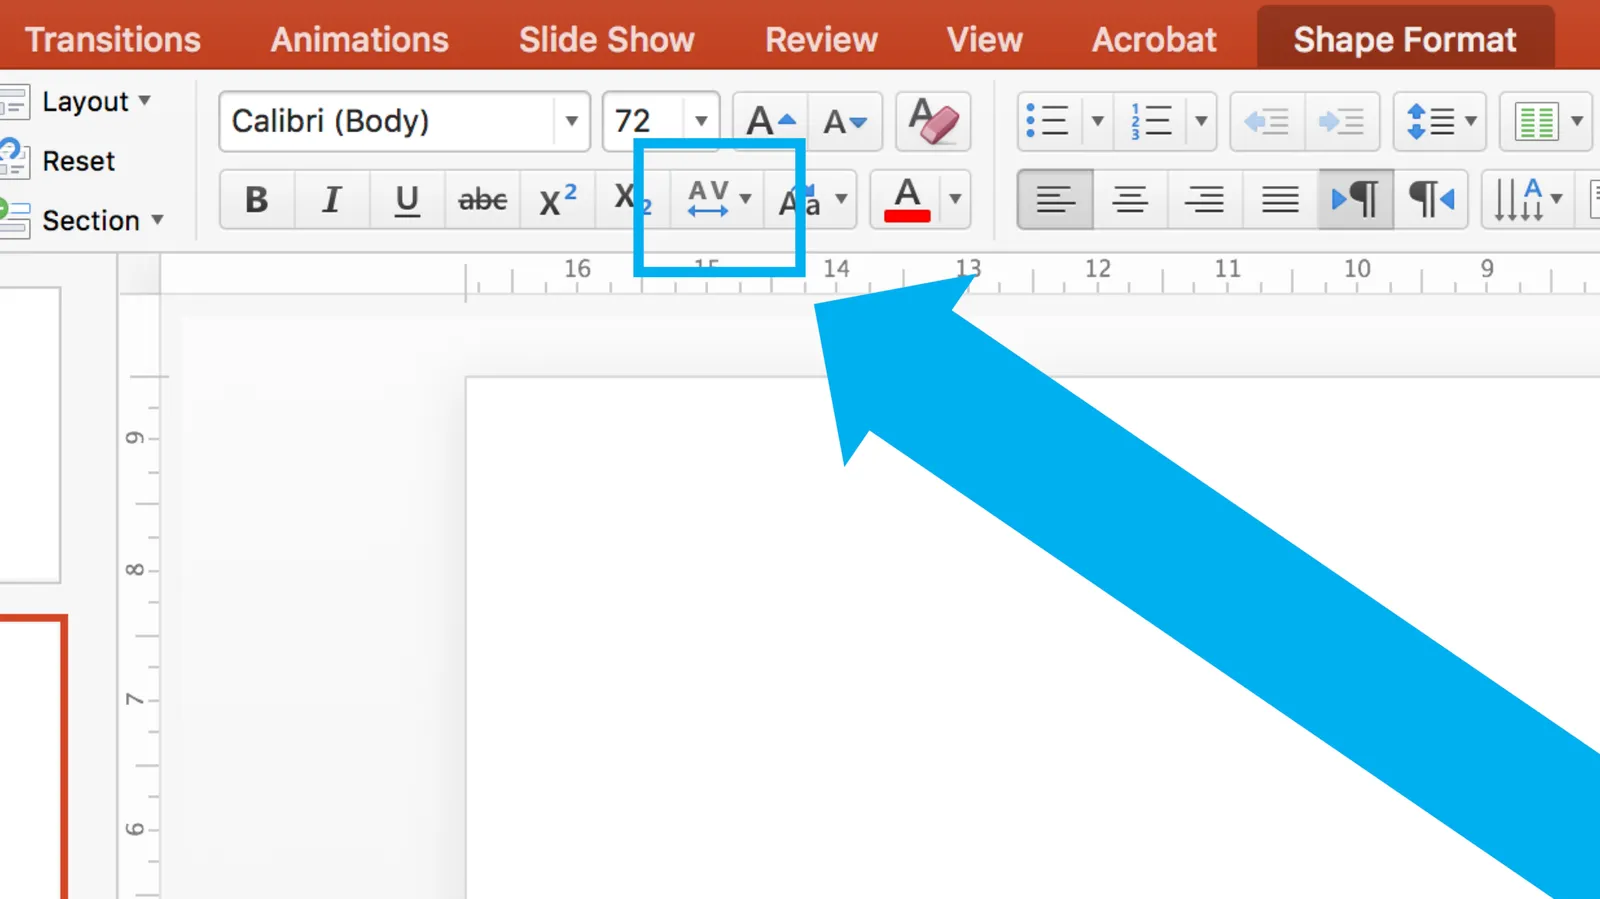
As an amateur designer of PowerPoint slides for a business presentation, you probably never need to worry about kerning. The one exception is cleaning up the mess that other users and/or templates have created. On the Mac, select all the text on a slide, click the little-used icon shown below, and set things back to “normal”

Cover image from WikiPedia

·Delivery

Presenting as a teacher

I got to speak with a high school teacher yesterday and he made an interesting remark about the use of on-screen presentations in the class room. He uses pictures and very simple visual concepts to keep the attention of the teenagers focused. The charts’ main purpose is not to transfer information, they are there to keep people focused and interested.

What a different approach than most of my teachers in the 1980s: copy a page from the course book on an overhead transparency and uncover paragraph after paragraph, slowly. Or, turn your back to the class and re-write the book on the black board.

Image from WikiPedia

·Software

Organising application windows

Yesterday I wrote about how difficult it is to keep your application windows organised across two very large monitors. Colleague Nick Smith pointed me to this neat utility: Divvy. It creates a pop up grid that allows you to position windows quickly. Available for both Windows and Mac OSX. This features should be baked into operating systems as a standard feature.

·Hardware

5k screens

I broke my laptop screen and was forced to rethink my IT setup. For the first time in 10 years, I went back to a desktop as my main computer: the 27" iMac and will fix up my laptop as a secondary computer for onsite client work or travel. My desktop is also connected to one additional large Thunderbolt display.

The difference between the 5k monitor and the Thunderbolt screen is amazing. After working for 1 day on the new screen, you can’t imagine having had to deal with this grainy Thunderbolt monitor for a couple of years. (The Thunderbolt screen is long overdue for an upgrade).

Two big monitors work also better than one big screen and a laptop as a side monitor. Mac OSX is still clunky when dragging large application windows between different size screens. You always had to fiddle and resize windows. Now that the monitors are more or less the same aspect ratio I no longer have that issue.

Still I believe that the fluid window-based operating system where you can resize and position windows where ever you want them creates messy work environments. Mac OSX needs some sort of grid structure where you can snap things into place. Maybe an extension of the new multi-app feature that is now part of iOS.

When going back to desktop you need to budget for one more piece of equipment: a backup battery (UPS). The power goes down, your computer goes down. Apple should have put in a 5 minute battery that enables you to power down the machine orderly in case of a power failure. The latter we tend to have here in Israel in the middle of the summer when air conditioners drive the power grid to its maximum capacity, or in the winter when violent thunderstorms hit power lines.

·Layout

One visual concept

I like to use one single visual concept as much as I can in a presentation. Two by two matrices, graphs, frameworks, they all require time to absorb by an audience. If you have to through in a new one on every single page, things can get pretty tiring. Management consultants tend to do this, and forget that the audience did not spend 3 months on the project but is hearing the story for the first time.

Luckily common issues in a presentation are often related:

  • Why is something difficult to do  (problem)
  • What is your solution
  • Why is the competition different

If you can fit all of this in a variant of the same diagram, you will save the audience a lot of time.

Art: Robert Antoine Pichon, Le Pont Aux Anglais, 1905

·Hardware

Note taking on iPad in 2016 (2)

I now have spent more hours taking notes and sketching with my iPad Pro 9.7 + pencil combo (read the earlier post). Things are still not perfect.

Taking notes

The big issue is instant availability of your canvas. Keep the screen on continuously and you drain your battery in less than an hour. Do auto-power off and you find your self do this for every single scribble you want to make 1) press home button 2) touch id 3) touch canvas to activate the writing surface. The latter is probably an issue in the Evernote Penultimate app, which has 2 modes: One where you view notes, and one where you can edit them.

Sketching ideas

  • The 9.7" screen is to small for sketching big, bold concepts, I need more space. (But then I don’t want to carry an iPad Pro 12" around). You actually need 2 devices.
  • Current apps don’t support erasing very well. You have to go into a menu, change the pencil to an eraser, erase, then switch it back again. Maybe Apple can put a sensor in the back of the pencil and make it an eraser, or could enable the use of multiple pencils in the same app. My creative process is rather paper intensive. I use a huge pile of old paper: make a bold sketch, toss it away, make another one, and another one, until I iterate to a chart in 10 loops or so. Even the pretty app Paper by 53 does not accommodate this workflow.
Continue reading →
·Story

Convincing the centre

The presidential campaign is gearing up in the US, and opinion pages and social media posts are full of passionate declarations of support and/or disapproval of a specific candidate. Most of these are not going to convince people to change their mind though.  In most cases, the audience and the “presenter” probably agree already, they read the same newspaper, watch the same channel and are friends connected on social media.

To make change, you need to convince the people that are doubters, the people in the centre. You don’t do that by implying that supporters of the other side are not very smart or insulting them in other ways.

Think about the doubters, what it the final straw that might convince them to switch sides?

Image from WikiPedia

Making market analysis work credible

When there is not much information about a market available, startups sometimes commission new research to dig up the facts and make projections. The end result is often a slide with one number: “Our extensive research shows that the market will be $1,0234,654 in 2020, the full report is too detailed and we won’t bore you with it”.

Investors are not going to buy this.

Here are some things you can do:

  • If the research was conducted by a reputable consulting firm, put the source prominently on the slide. But not many startups can afford rubber stamping buy expensive consulting firms.
  • Round up your numbers. $1.0b is better than $1,0234,654
  • Break up your $1.0b in individual market segments (if you can)
  • Relate your $1.0b to something that exists today. Your precise market does not exist yet, but people spend money on activities that are related, similar.
  • Show a deep dive on one segment, one part of the analysis to explain the thorough methodology you have applied, leave out the other 325 segments.
  • Break down the $1.0b in things people can touch: # of customers, price per product/month/subscriber,  # of countries, etc.
  • If you are getting only 5% of the $1.0b market, think about who will have the other 95%. If you cannot identify them, go back to your market estimate.

The above is useful when making the presentation, but can also be handy when you brief consultants for a project.