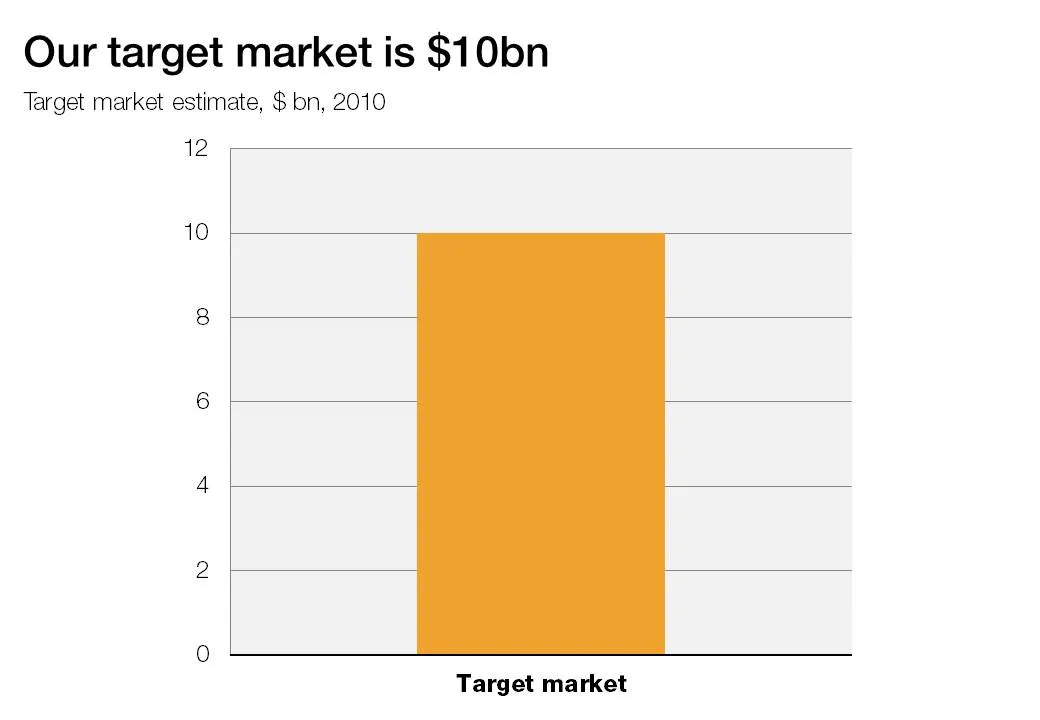
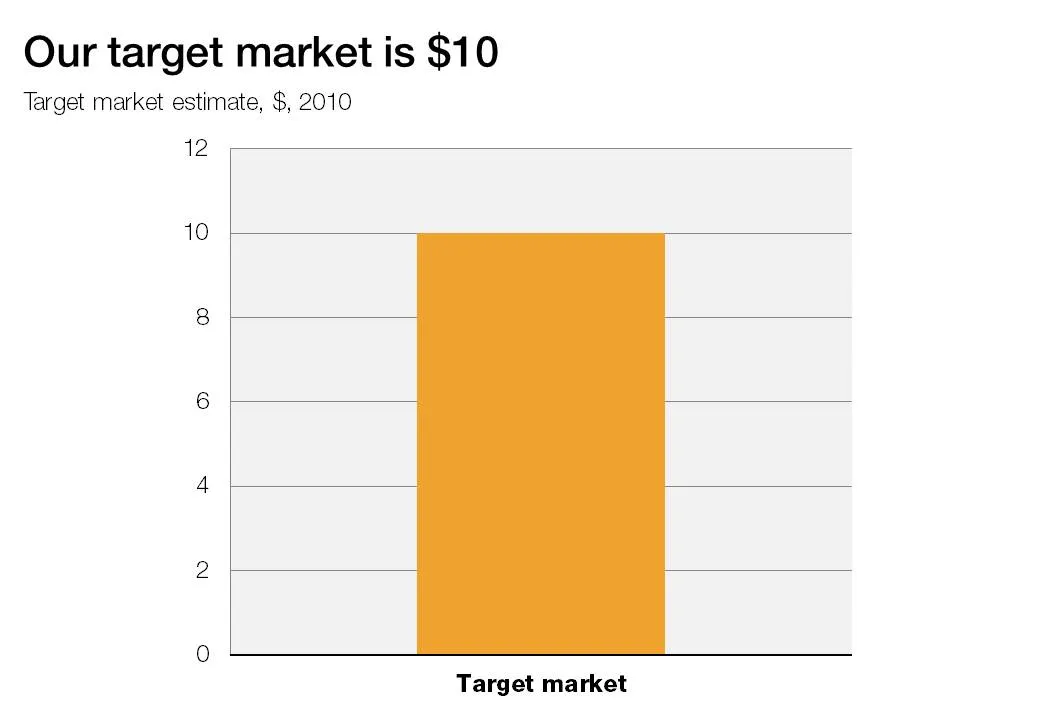
A column chart with just one lone column is not a column chart. Column chart need to compare things, show a trend over time.


Blog post
A column chart with just one lone column is not a column chart. Column chart need to compare things, show a trend over time.
About this blog
Notes on all things presentations — design, storytelling, and AI workflows.
Subscribe now to never miss a post.
About SlideMagic
A platform for business presentations.
A free student plan is available.
2 comments
“We use one for power. Use two for comparison, contrast. Use three for completeness, wholeness, roundness. Use four or more to list, inventory compile, and expand.”
Thanks fo the 'One Bar Graph'!