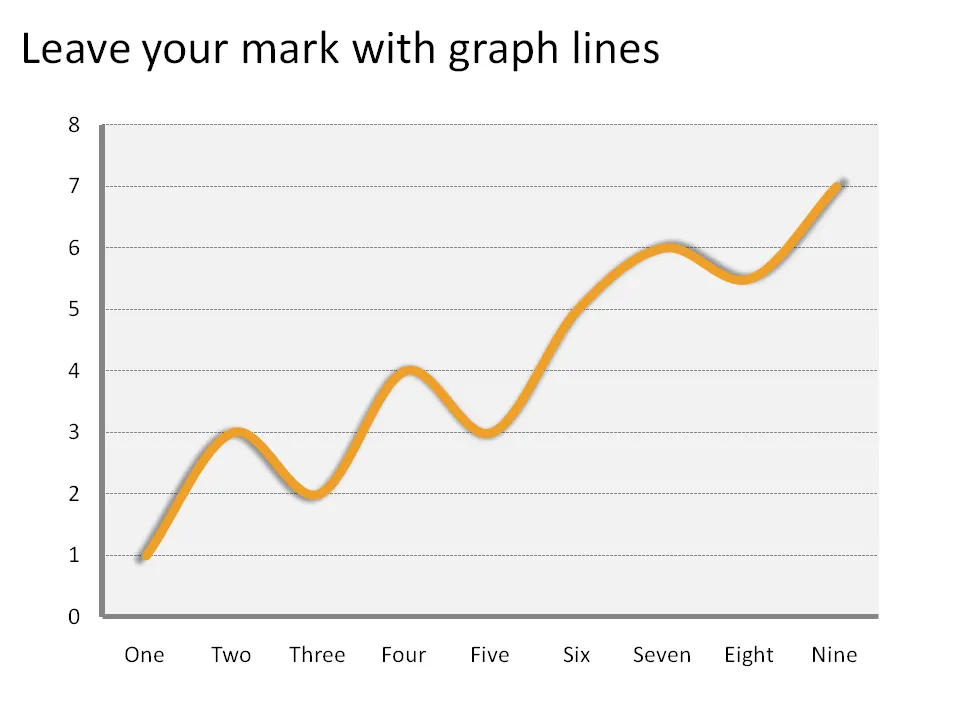
The standard chart templates in Excel and PowerPoint create fragile, thin graph lines. No one can see them. Right-click the line and make it bold and fat and it will stand out.


Blog post
The standard chart templates in Excel and PowerPoint create fragile, thin graph lines. No one can see them. Right-click the line and make it bold and fat and it will stand out.
About this blog
Notes on all things presentations — design, storytelling, and AI workflows.
Subscribe now to never miss a post.
About SlideMagic
A platform for business presentations.
A free student plan is available.