

Blog post

Explaining the revenue hockey stick in funding presentations

May 19, 2009 · by Jan Schultink
← all posts

One of the last pages in every venture capitalist funding presentation is the “hockey stick” of revenues and profits shooting through the roof. VCs expect a bit of optimism from a startup, but at the same time want to do a reality check on these numbers.

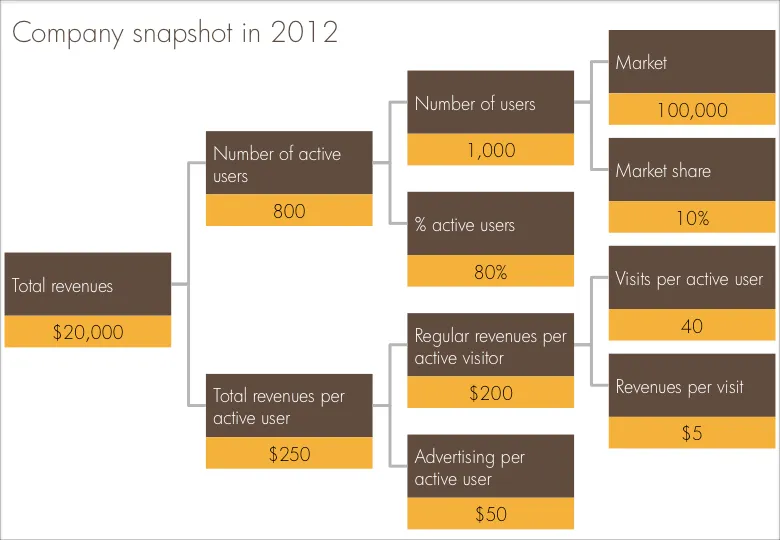
I often use a company snapshot, a tree of the key factors that add up/multiply to the projected revenue figure. Make sure the factors are real things you can touch: people, visits, etc.  CORRECTION: Also make sure the tree adds up and calculates through, something that cannot be said about the example below.
Data visualizationDesignPowerPointPresentation designPresentation

About this blog

Notes on all things presentations — design, storytelling, and AI workflows.

Subscribe now to never miss a post.

RSS

About SlideMagic

A platform for business presentations.

A free student plan is available.

5 comments

Jan Schultink2009-05-19 18:55:00
@Chris, I like to start with the big picture first, then break it down into its bits. Personal preference.
Anonymous2009-05-19 19:46:00
Indeed... Very nice site btw. Looking forward to your future posts!
Anonymous2009-05-19 12:14:00
Sorry, but according to my logic it would be much more readable the other way round - total revenues being on the far right.

Anyway, looks good, got all the necessary information, thx

Chris
Anonymous2009-05-19 17:04:00
- What about providing some idea of the ramp-up, showing both the figures today and in 2012?
- In this case we are speaking about 200k in revenues, if we have a 10% market share on a market of 100k users.
Jan Schultink2009-05-19 18:56:00
@Anonymous, thx for spotting the calculation error. Yes, you can include 2 years for comparison. In startups however, the early years are not really meaningful, lots of investment, no customers let alone revenues...