

On a few occasions, I had to use a combination of a cluster and a stack chart. This chart is not available as a standard option in PowerPoint. Here is how to make it:
- Create a regular stacked column chart
- Set the gap width to 0
- Blank out the data where you want the gap between the years to be
- Manually add labels for each of the years
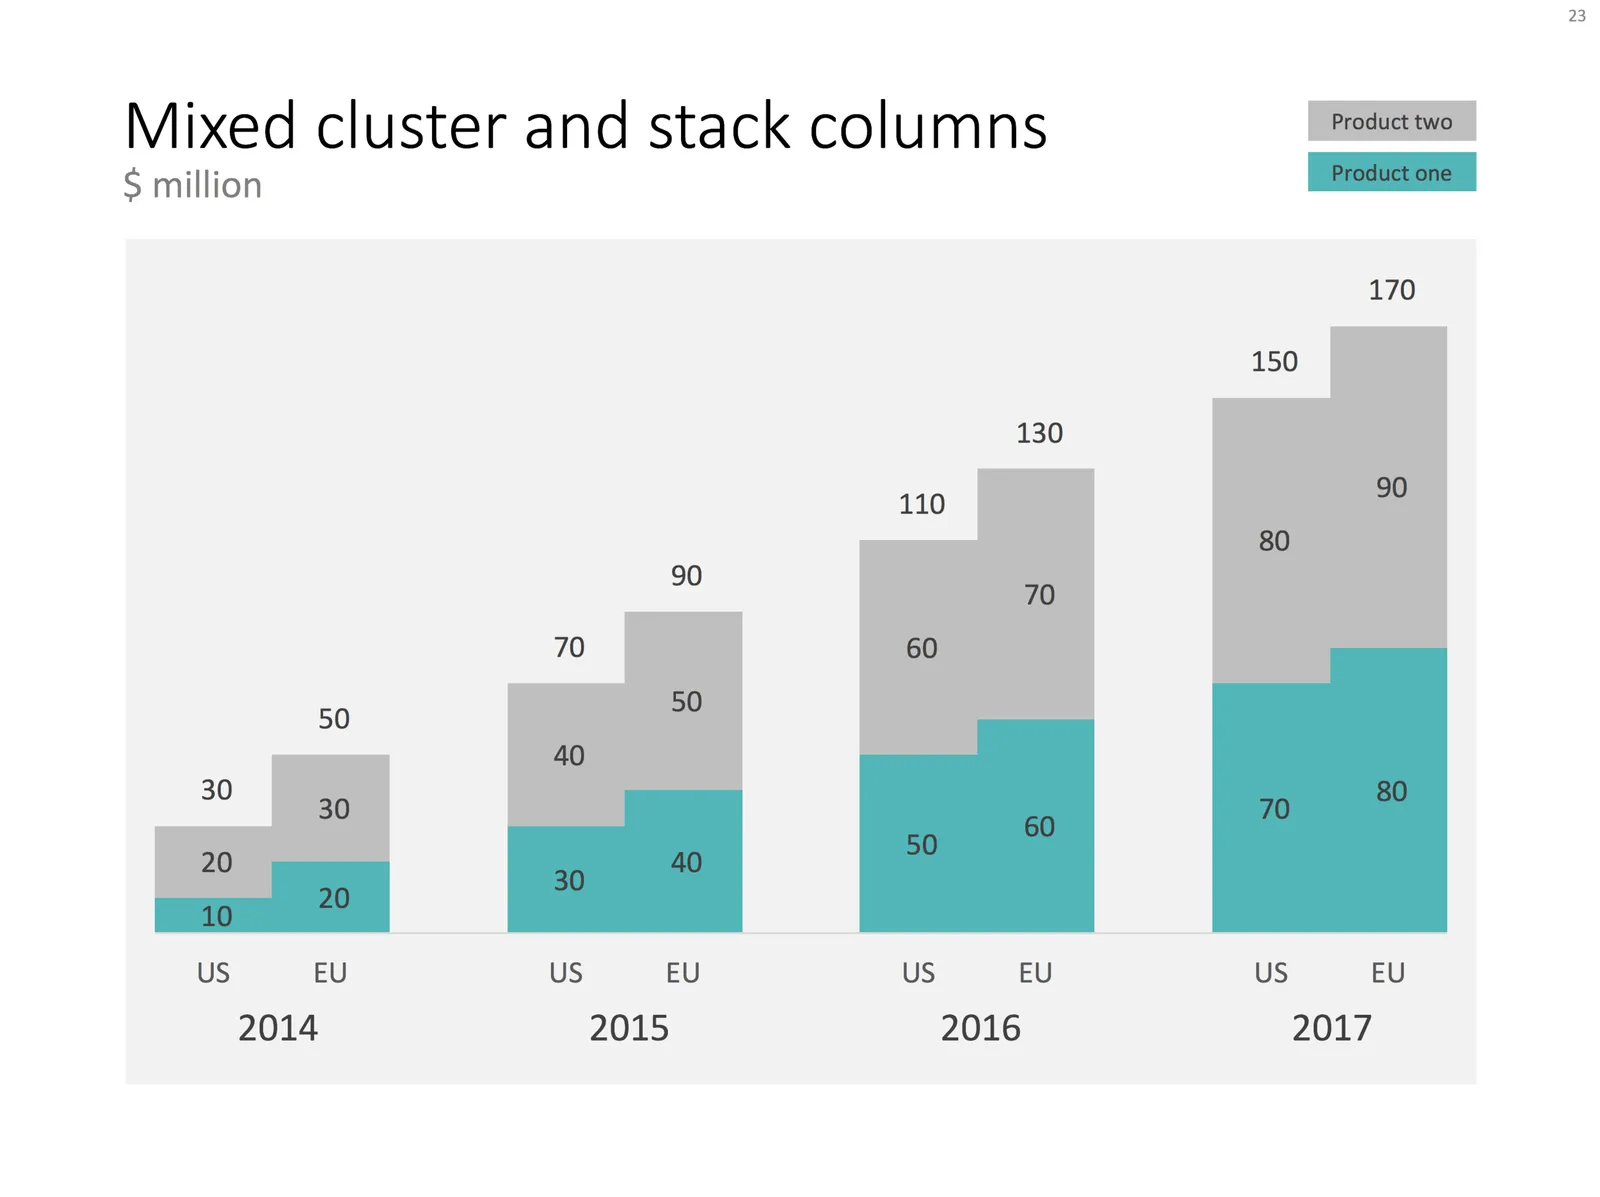
You can create one yourself using the above ingredients, or you can download the one I made in the SlideMagic template store: