

Waterfall charts are always an absolute pain to make. As my coding skills increase, I am getting more confident to add trickier things to SlideMagic ( tricker in terms of coding, not in terms of user interface). So, I have started to work on adding waterfall charts to SlideMagic. Below a screenshot of my development machine.
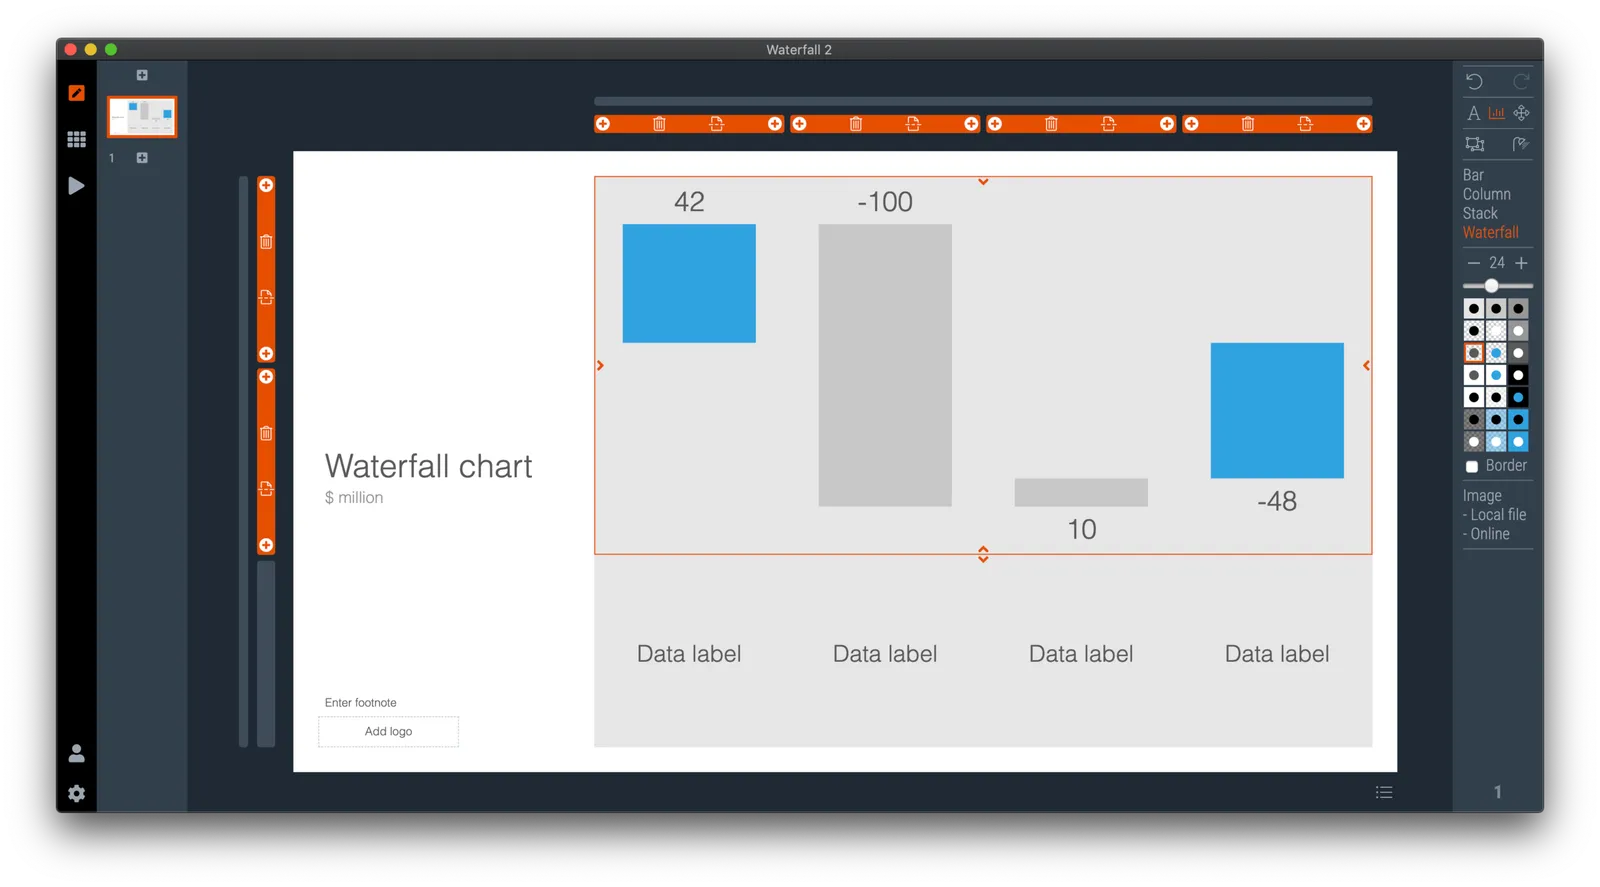
They should be in line with all the other data charts in SlideMagic, line up perfectly with the grid to make it easy to add data labels and incorporate them into the overall slide composition.
For many corporate users of SlideMagic, the killer feature might be the conversion of these simple waterfalls in a fully editable spreadsheet in PowerPoint/Excel.
Work in progress…
Update: the latest version of SlideMagic now as the waterfall functionality. It should work great in the app. PowerPoint conversions works as well except for the data labels. Let me know if you encounter any issues.
Photo by Robert Lukeman on Unsplash