

Data charts in SlideMagic work a bit different than in other presentation software:
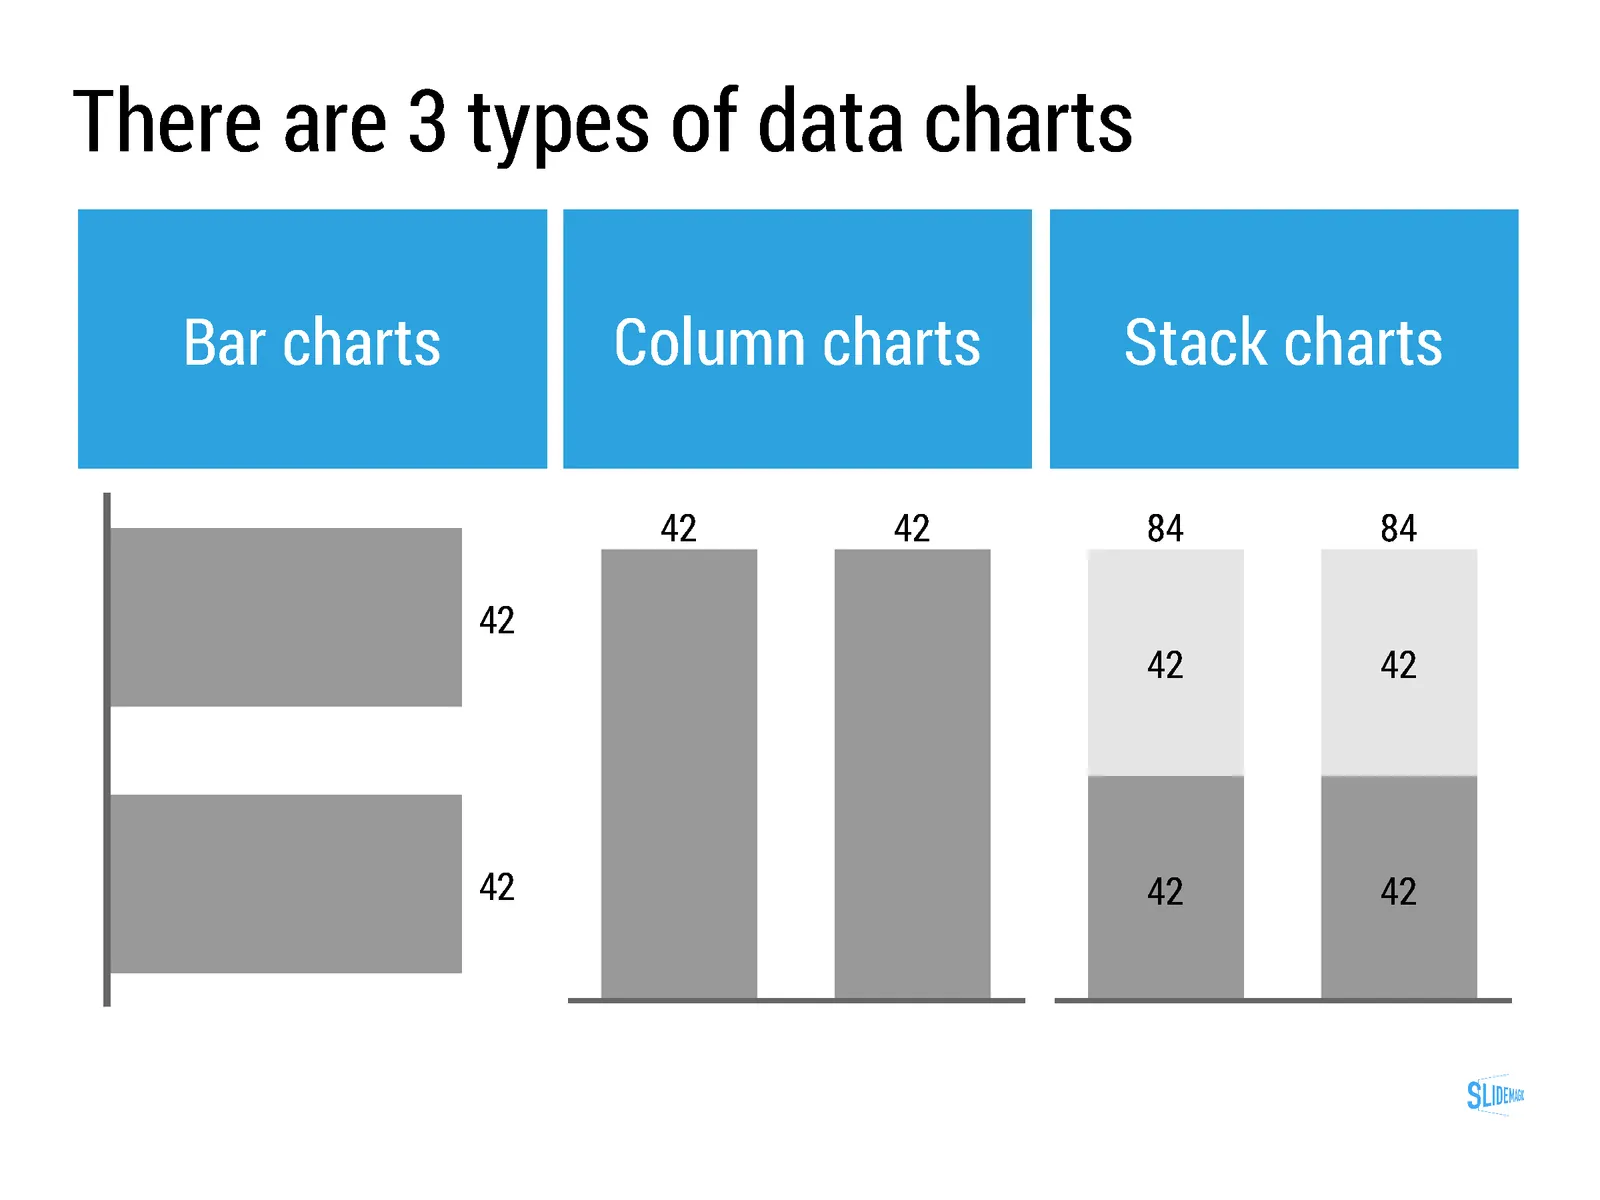
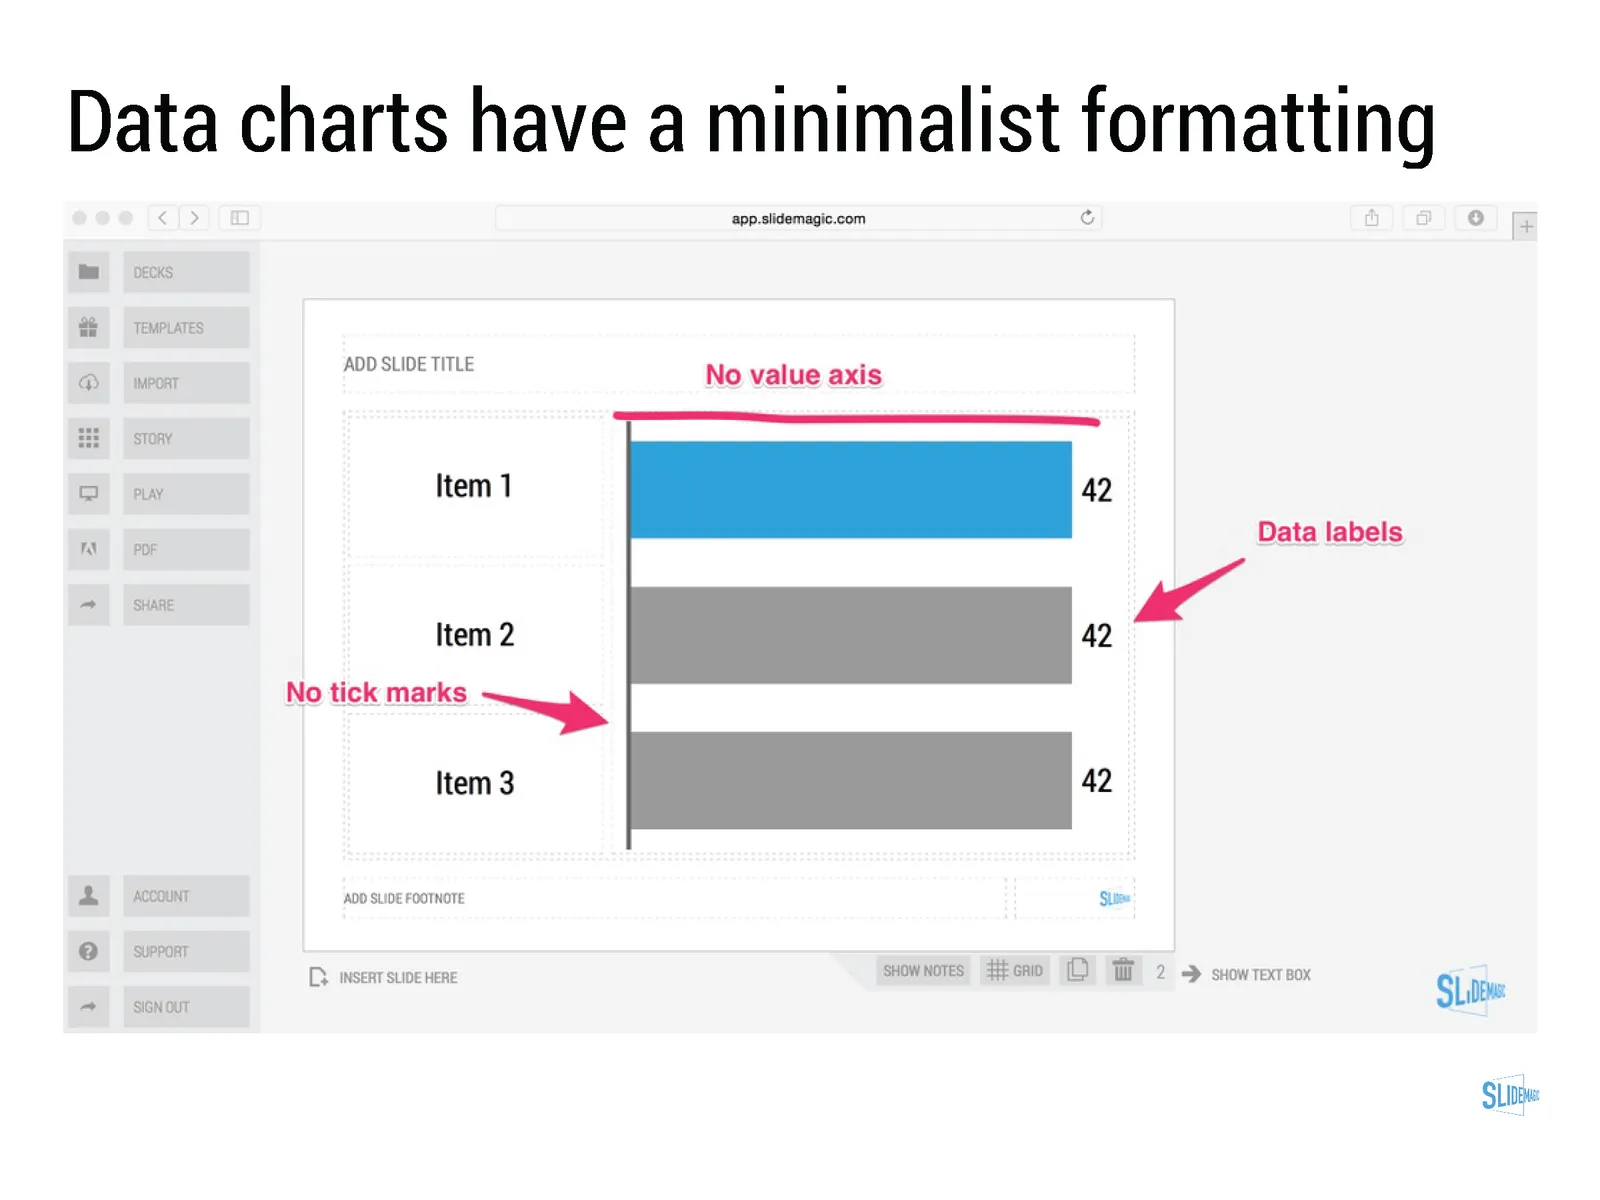
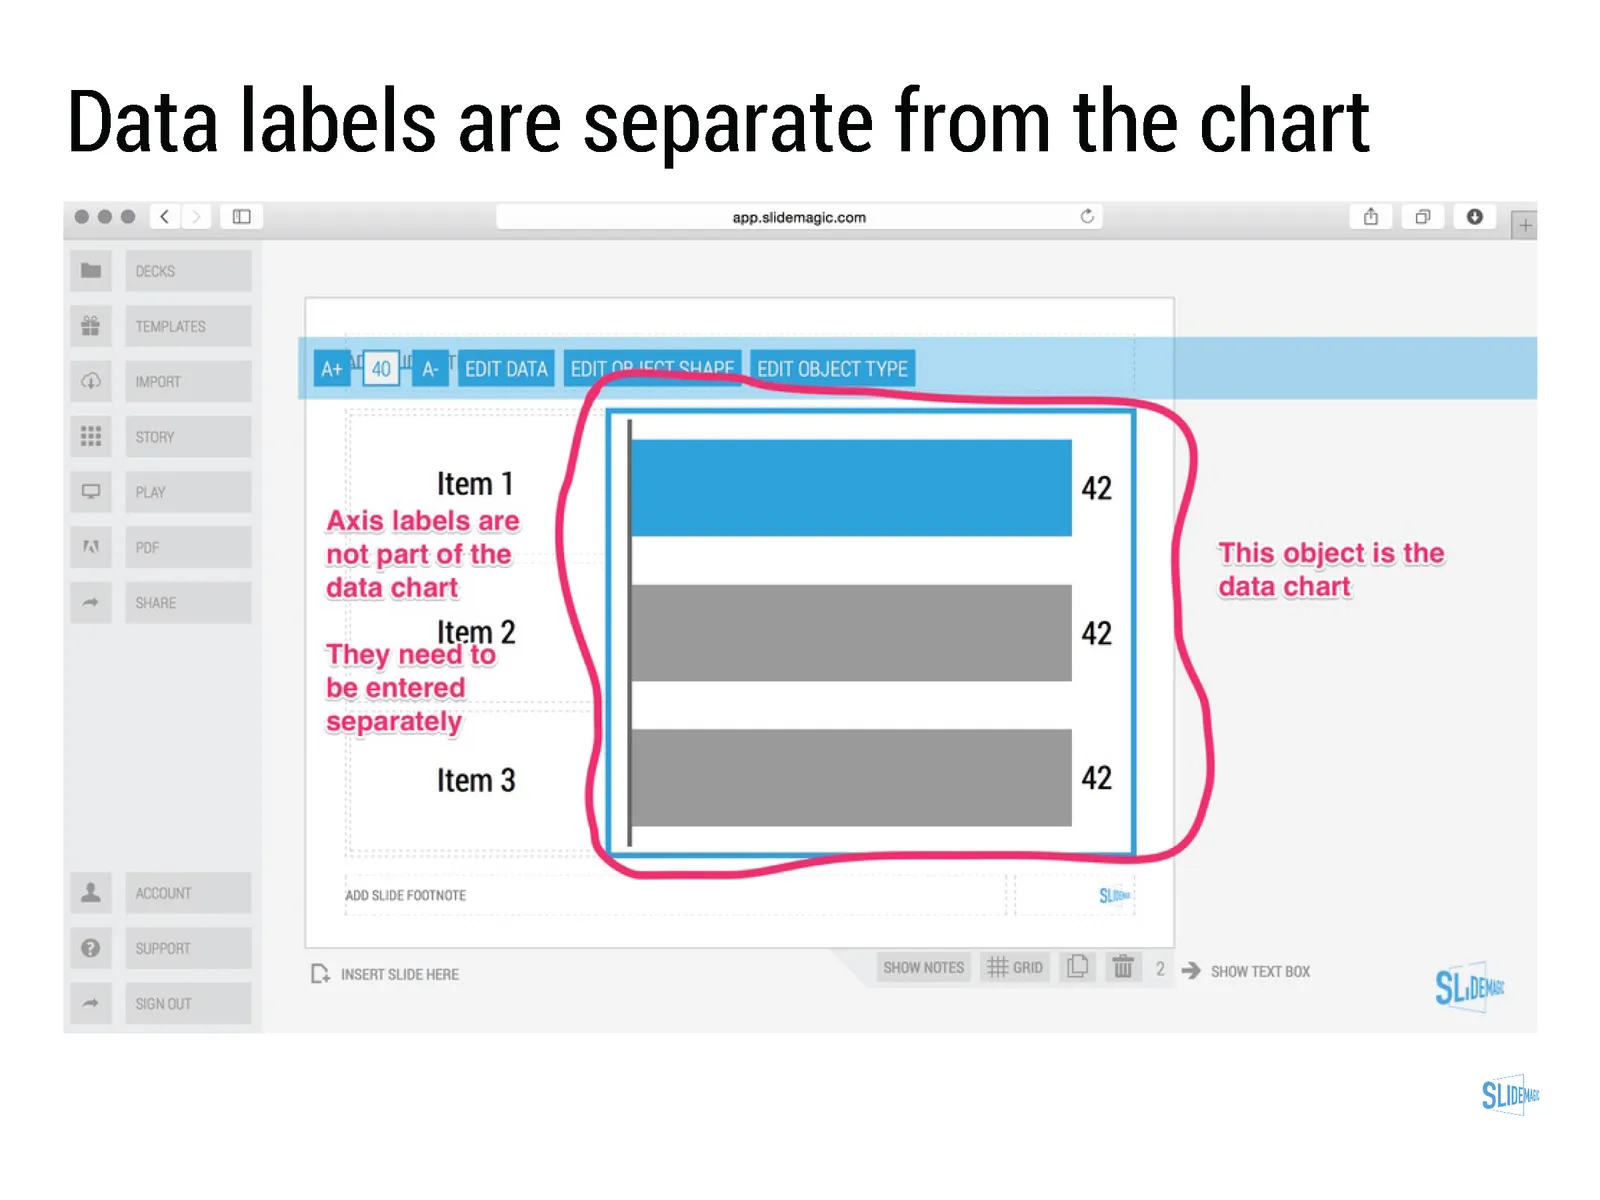
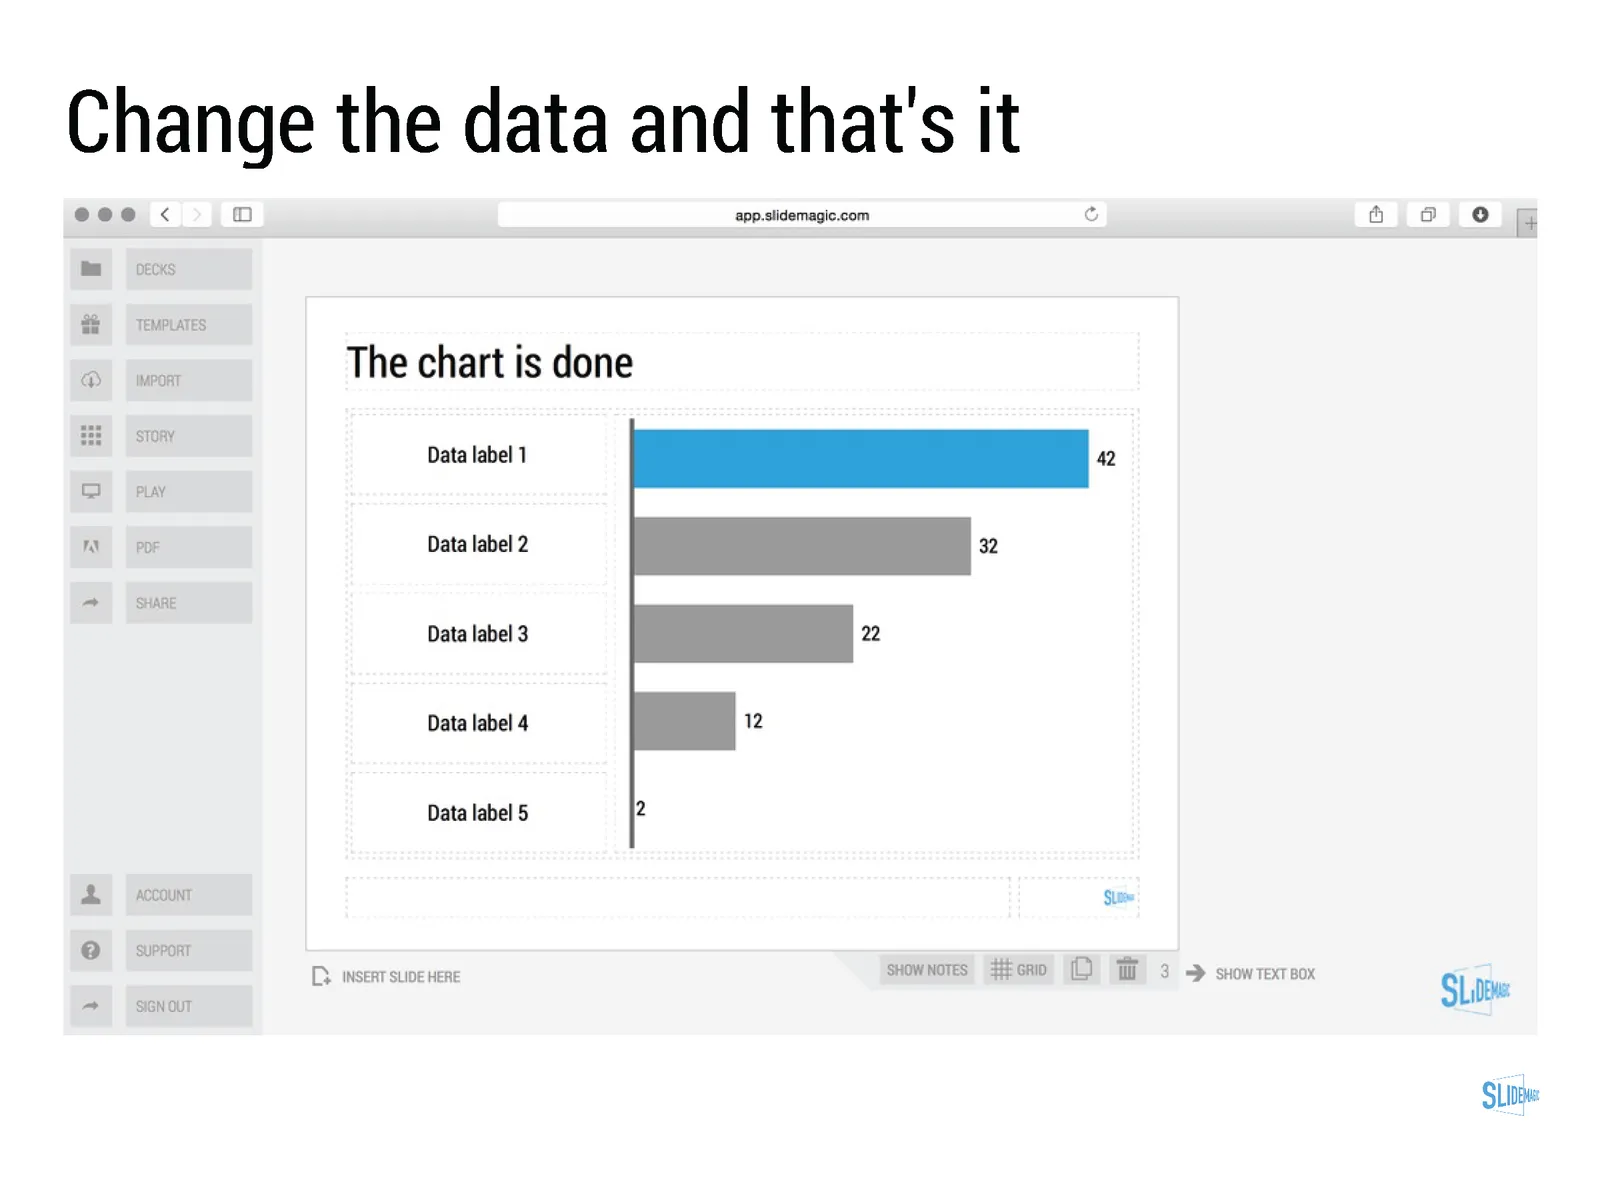
- Charts come in a beautiful, simple, formatting without the clutter of value (y) axes, tick marks. Charts are automatically adjusted to your own branding (the right colours, the right font).
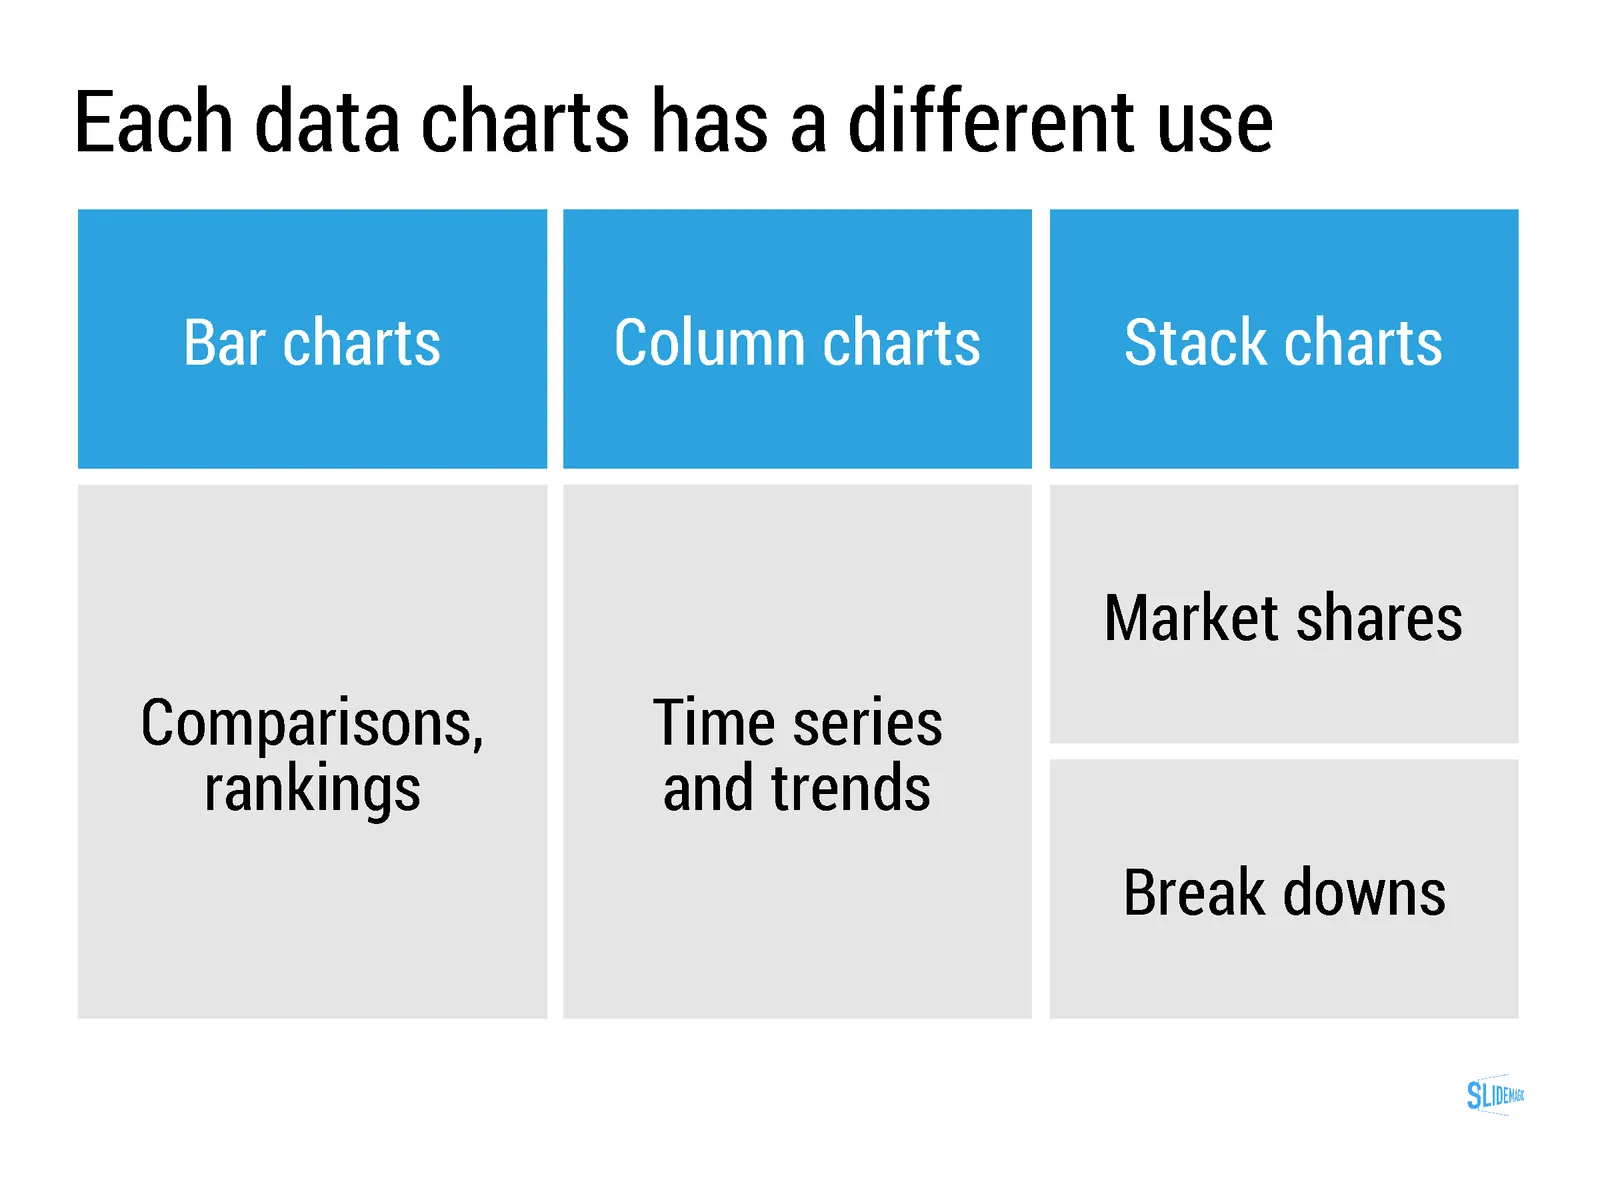
- SlideMagic only supports those data charts that I regularly use in my own presentation design project. No pie charts for example (sorry)
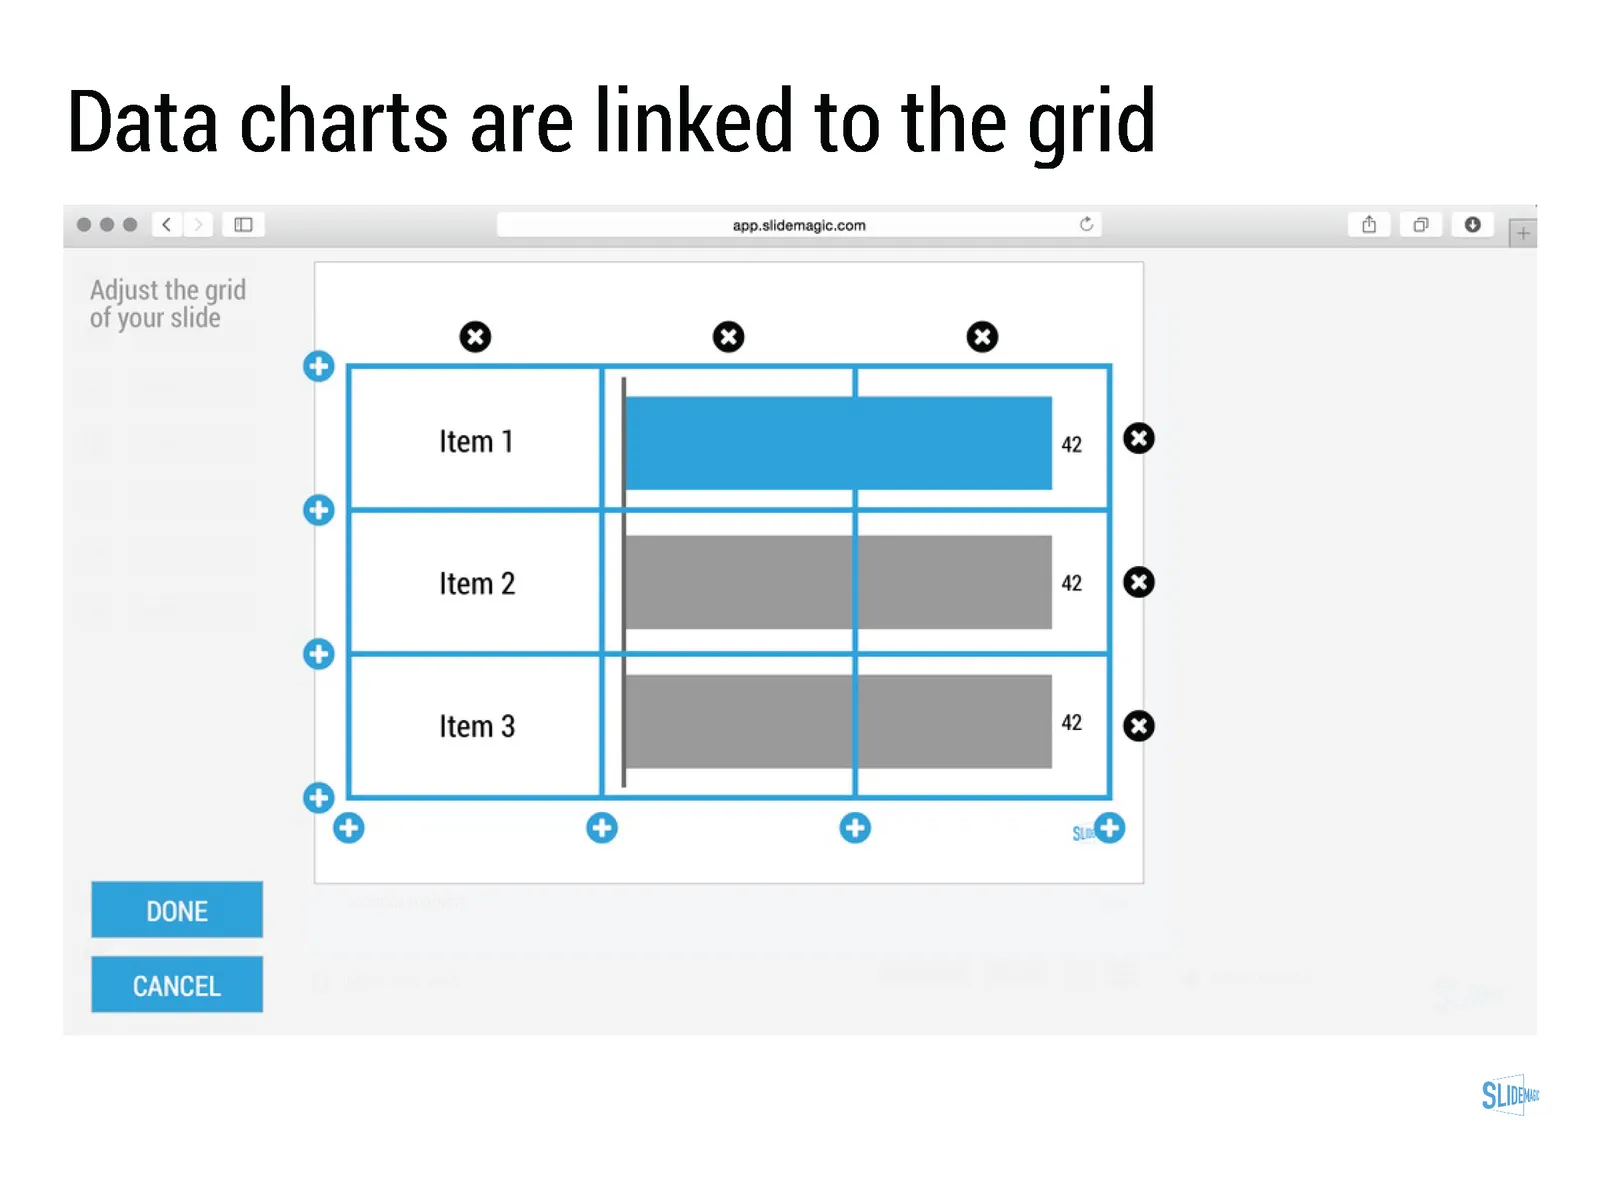
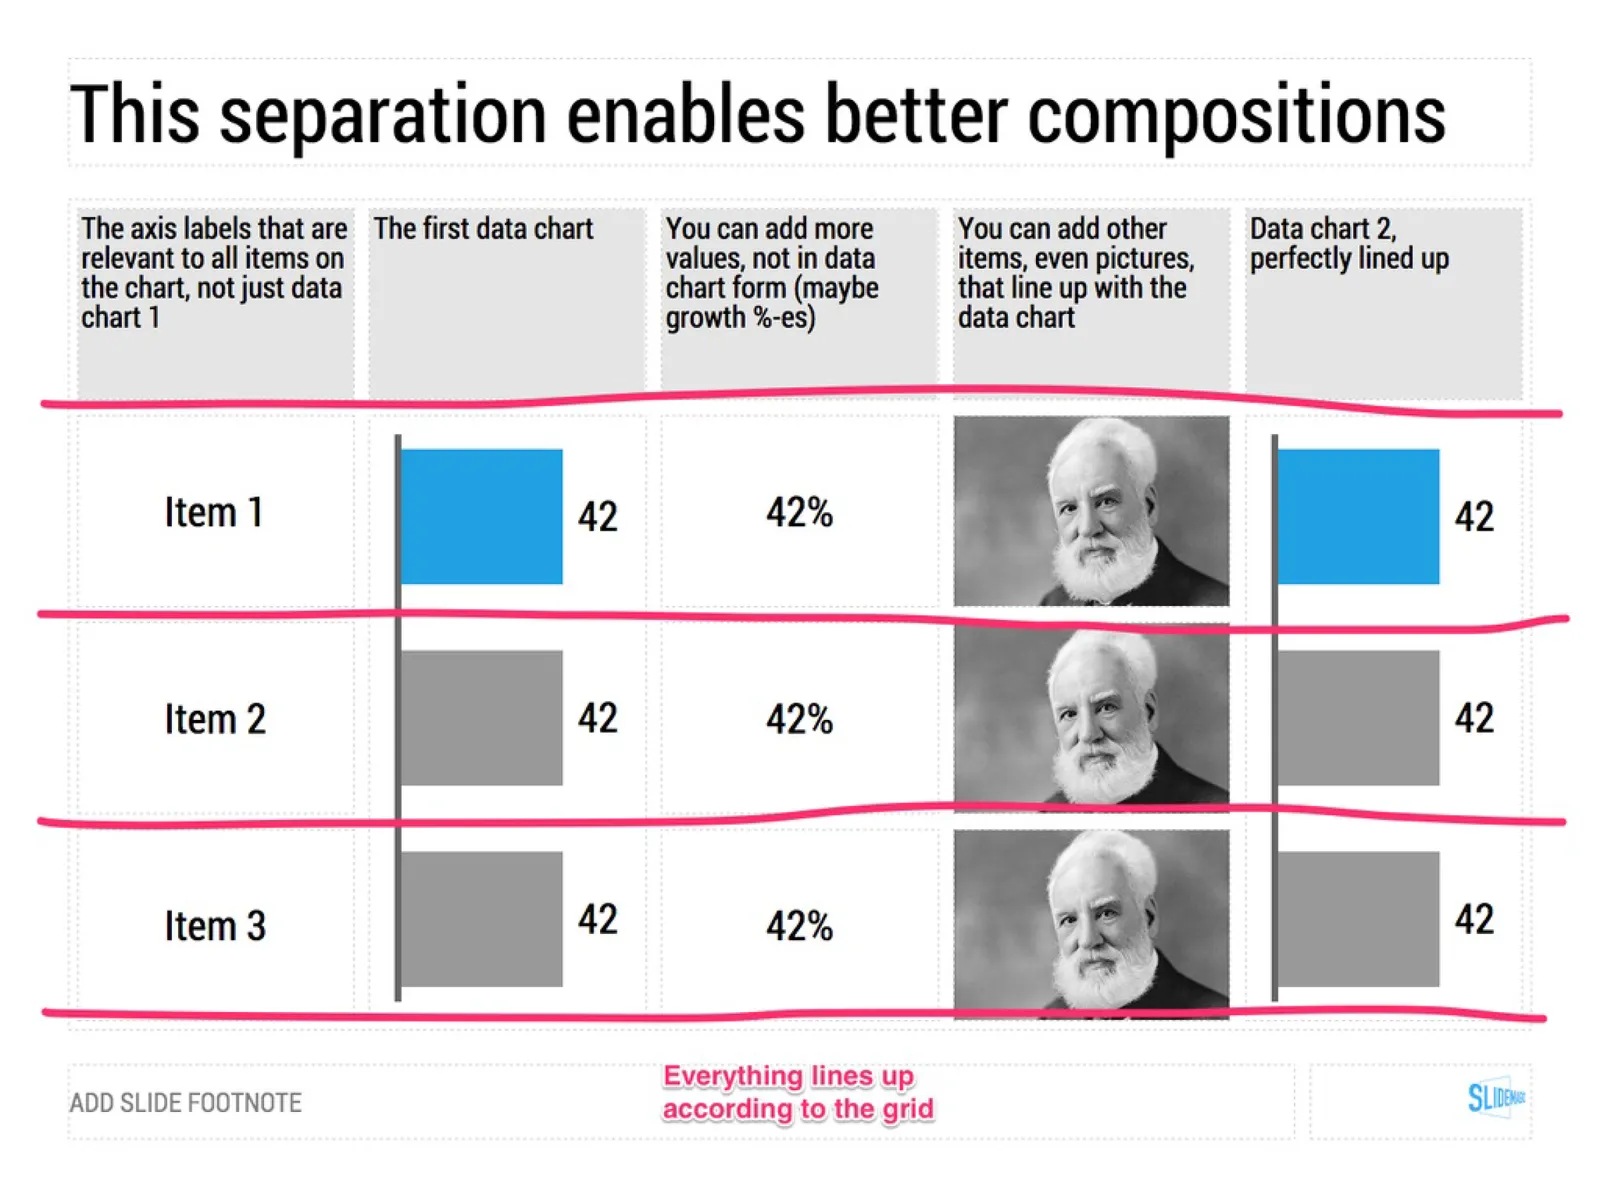
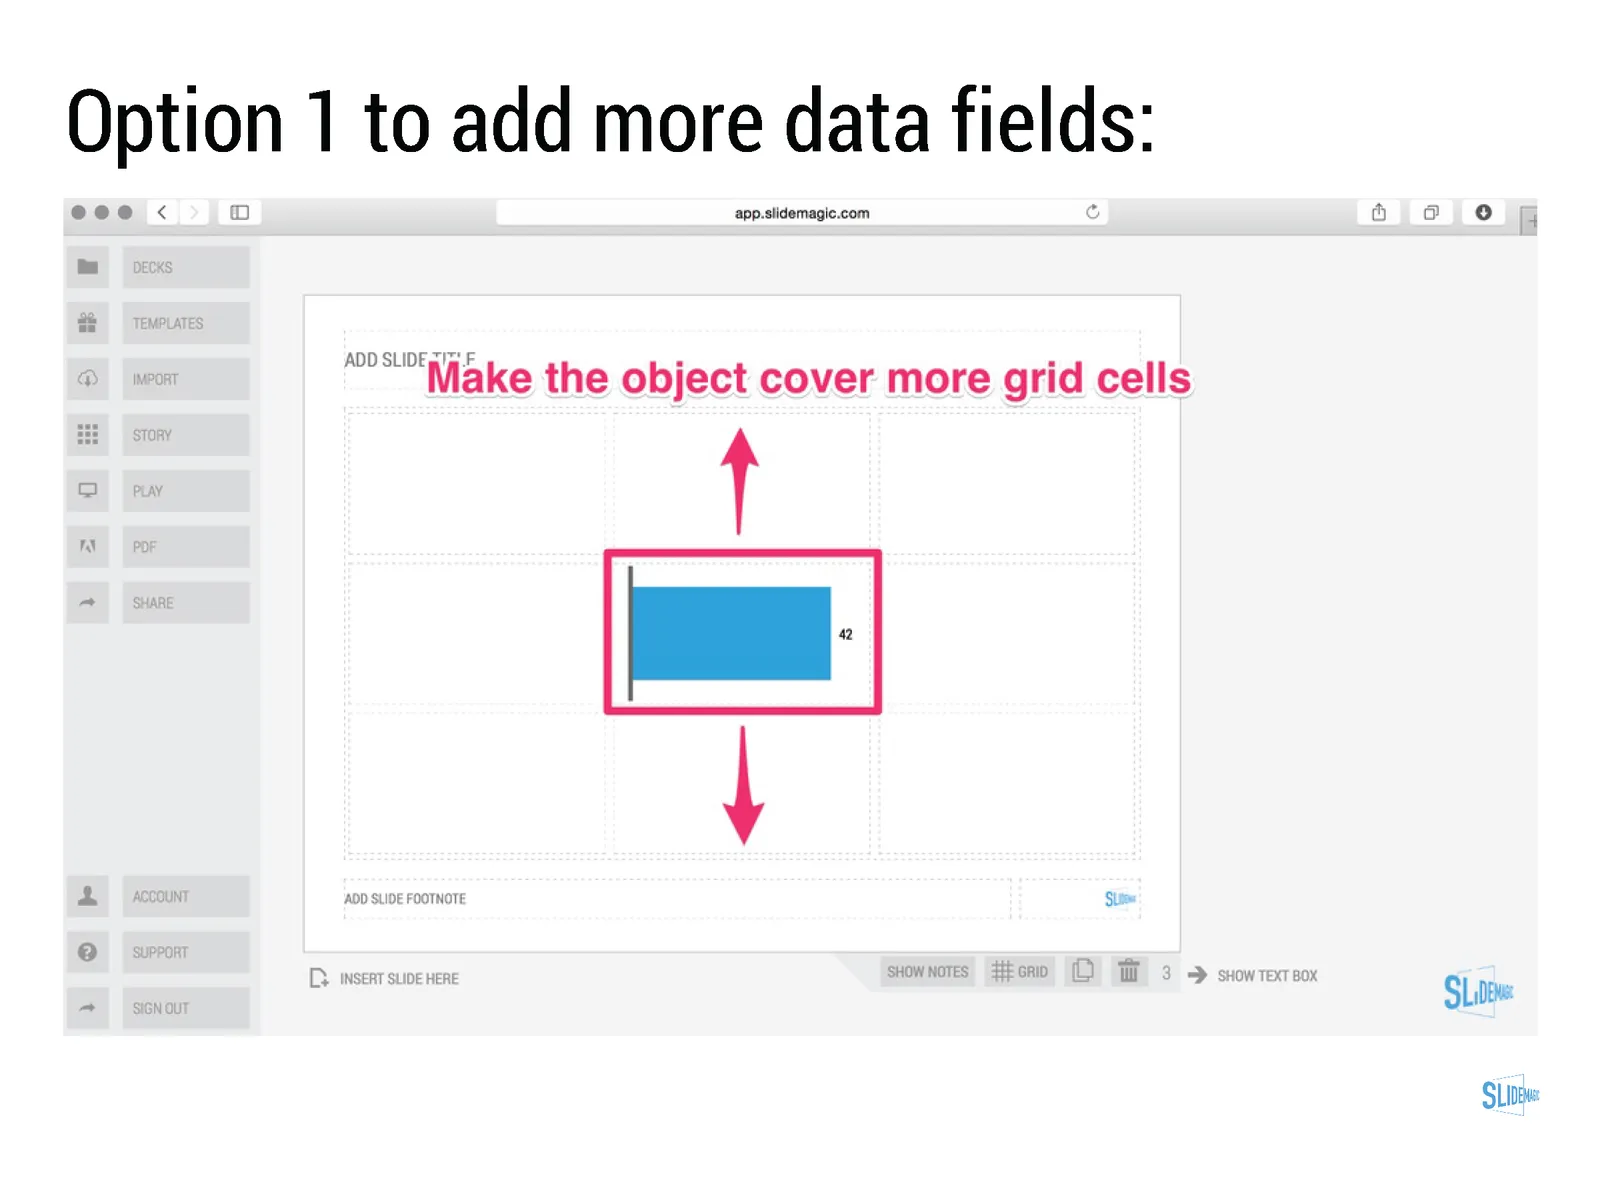
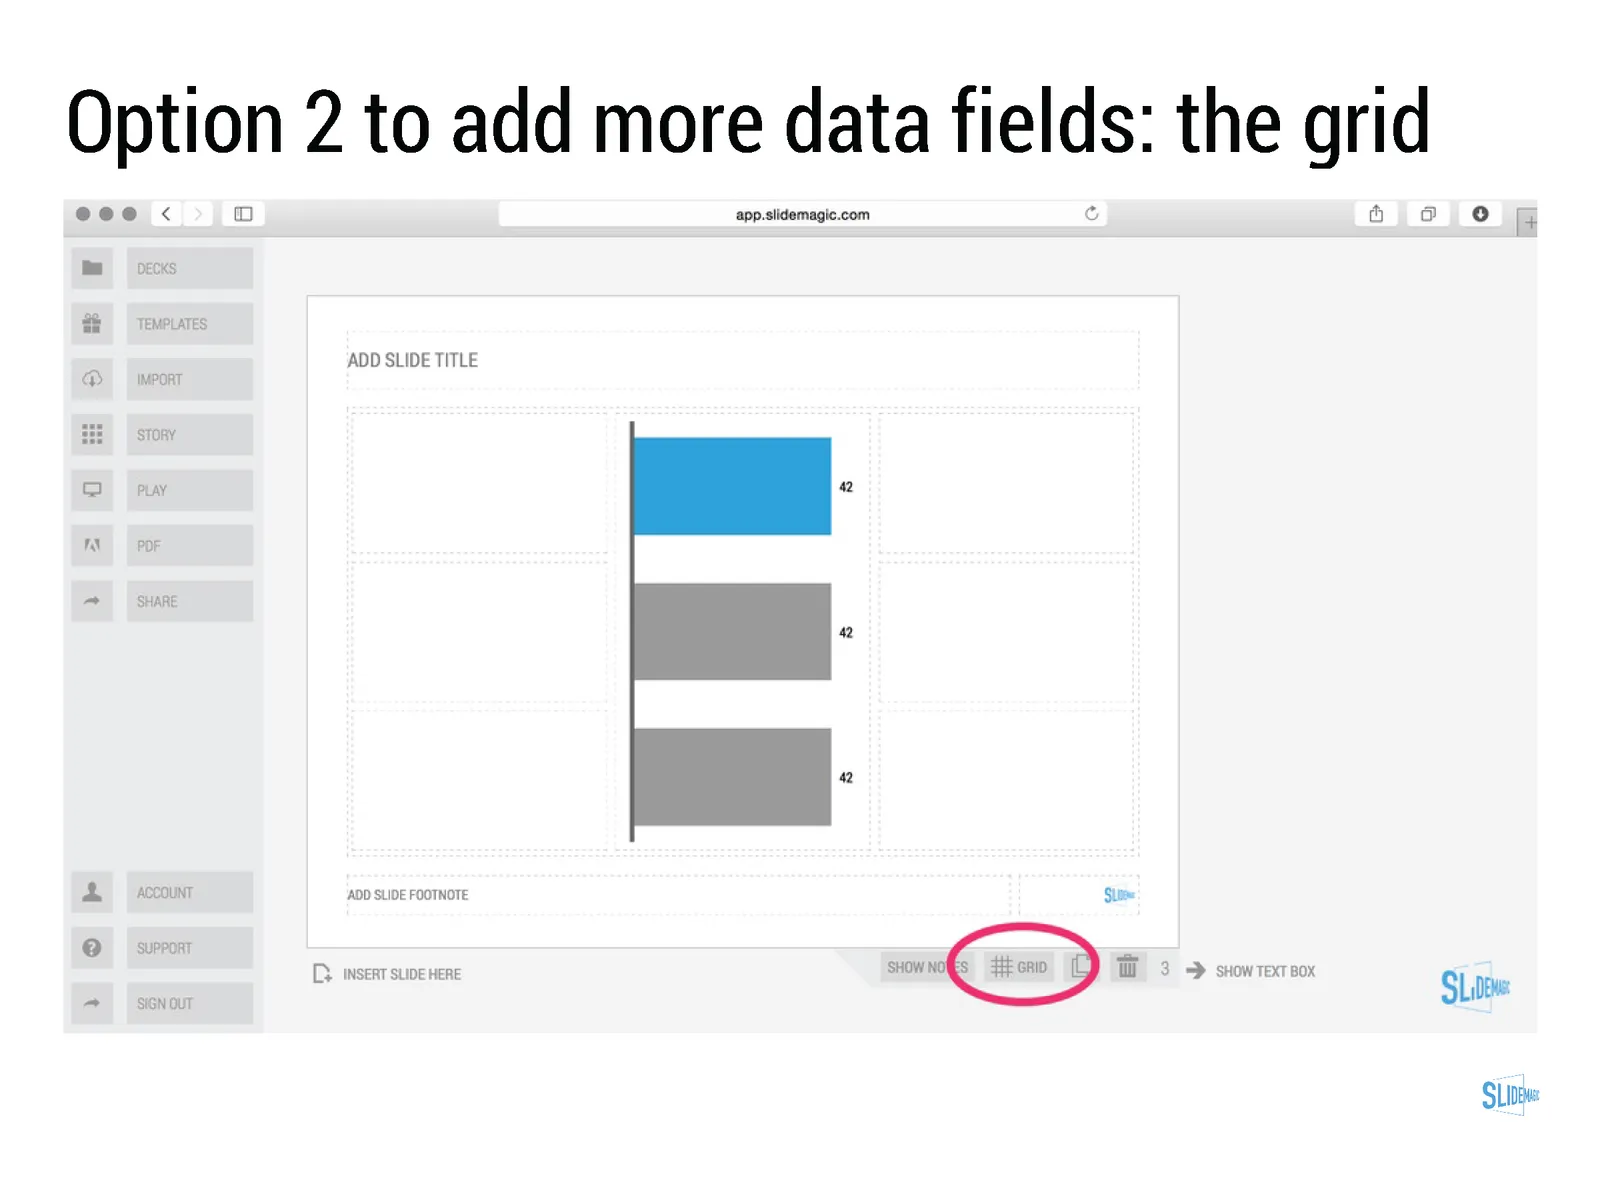
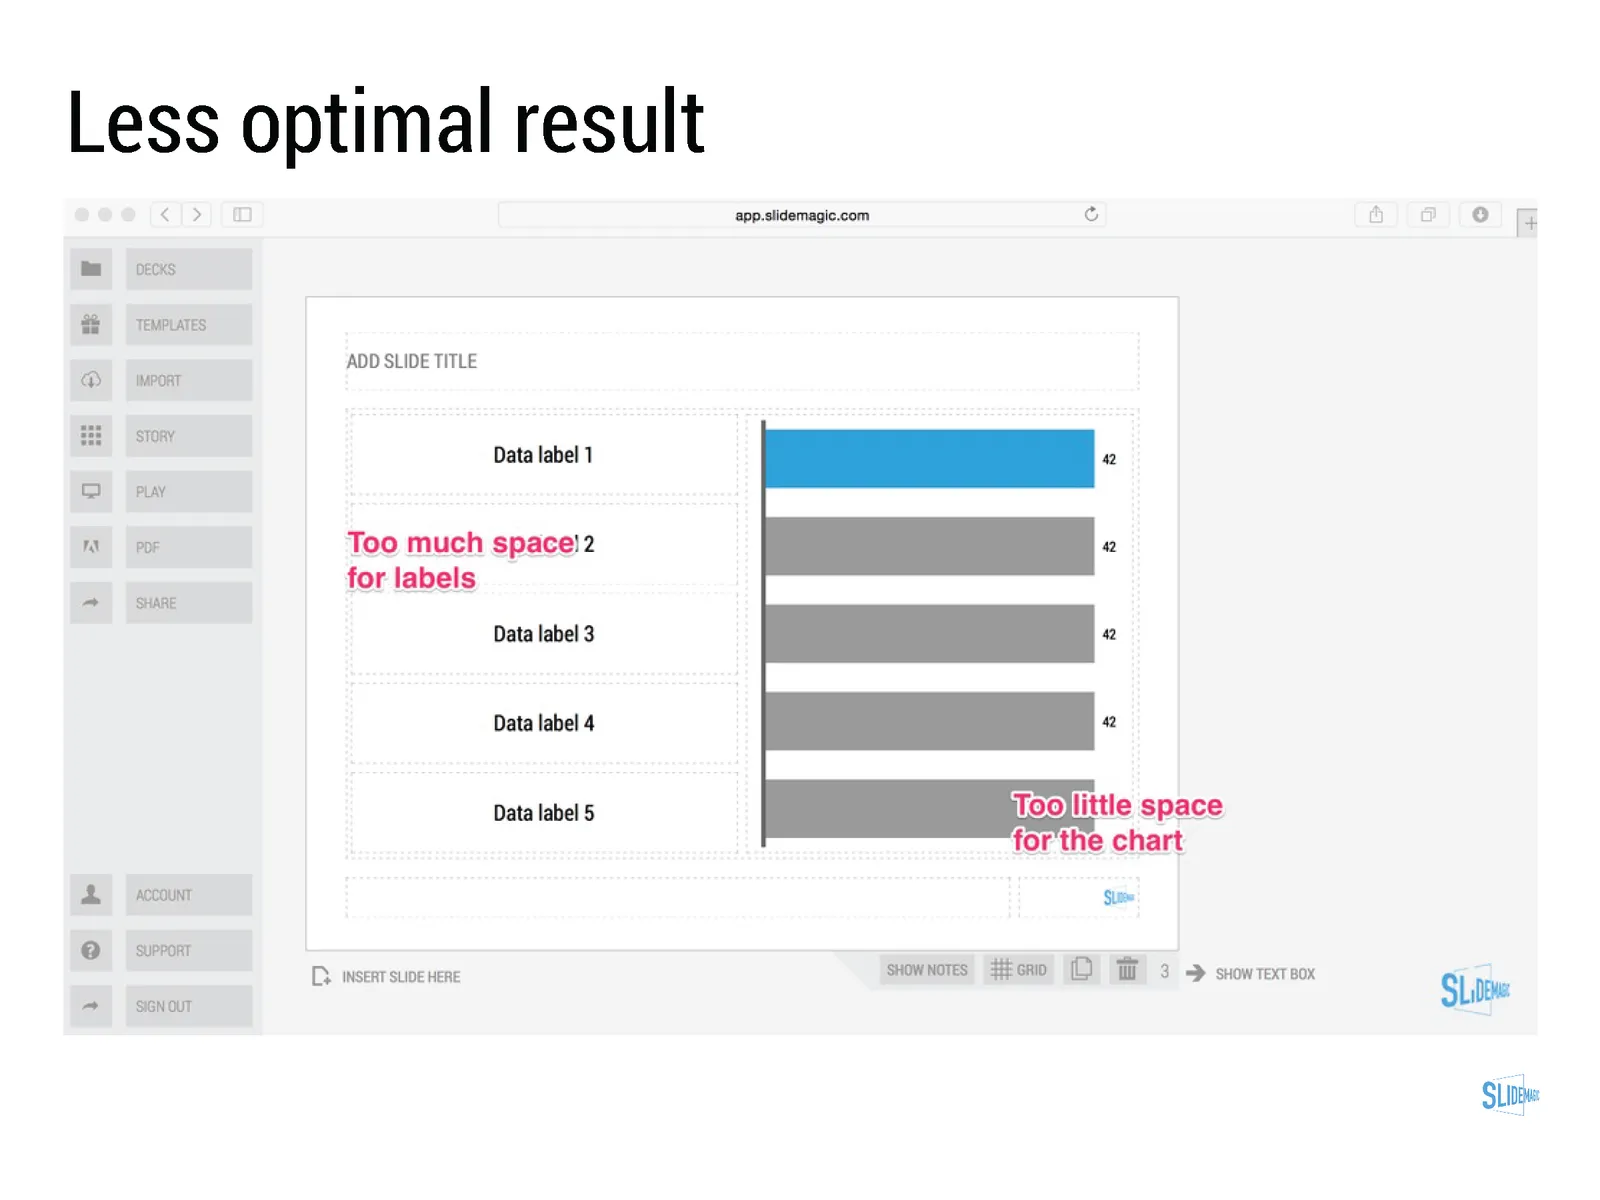
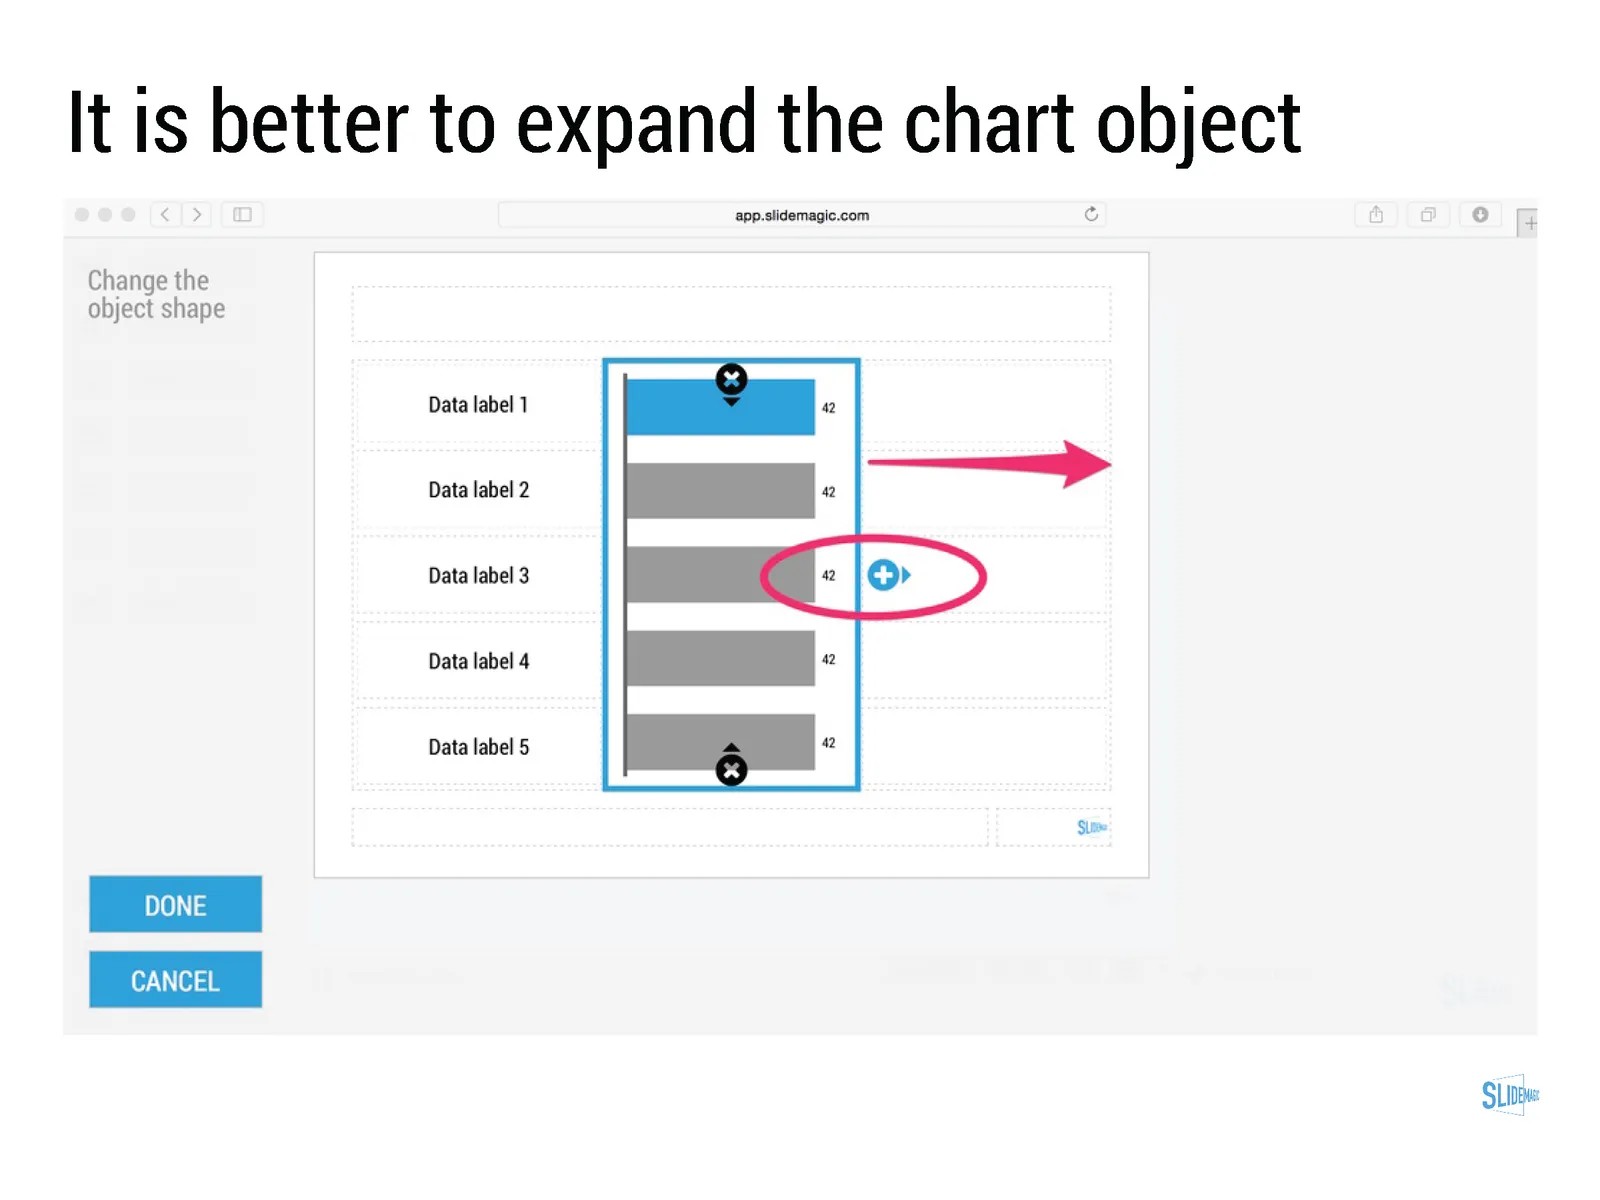
- Best of all: SlideMagic data charts line up with the grid of the slide. In most business presentations, data charts are part of a broader slide design. There is an extra column on growth percentage bubbles next to the bar chart. There is more than 1 bar chart on a page. In PowerPoint it is very tricky to get these things to line up properly. In SlideMagic, it is not possible, not to line them up
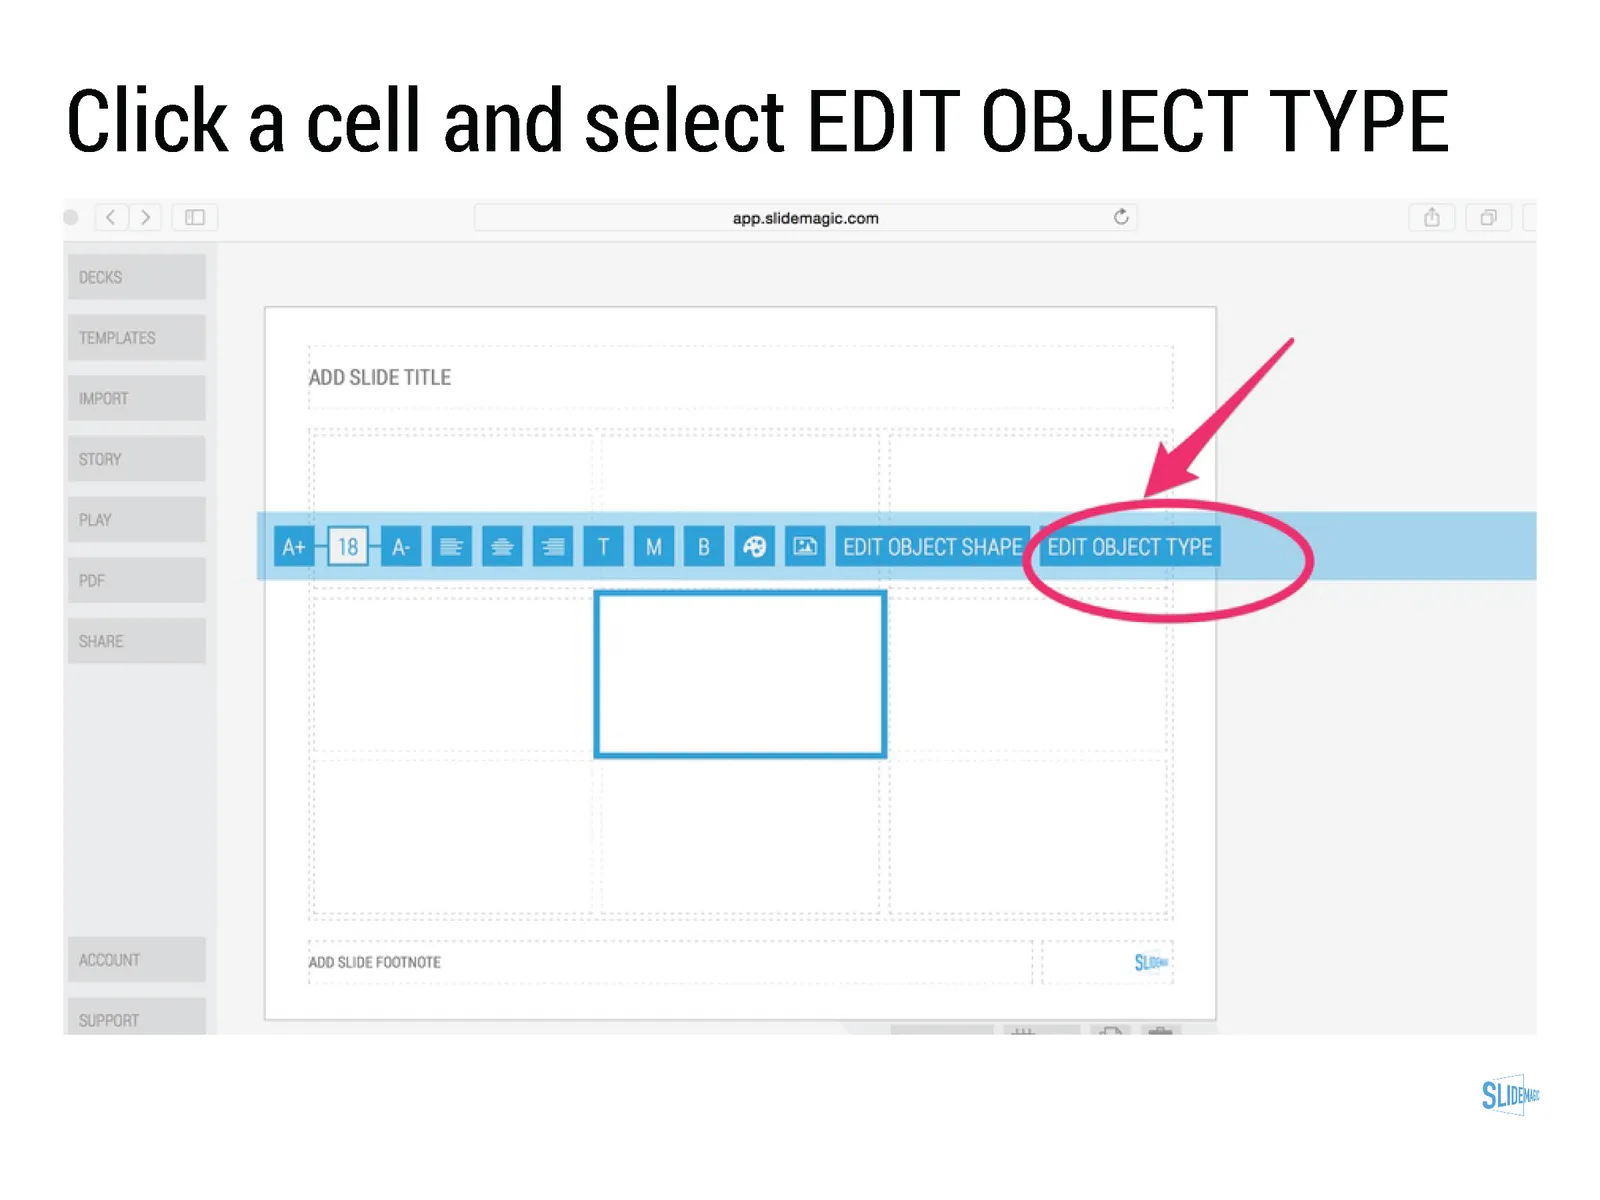
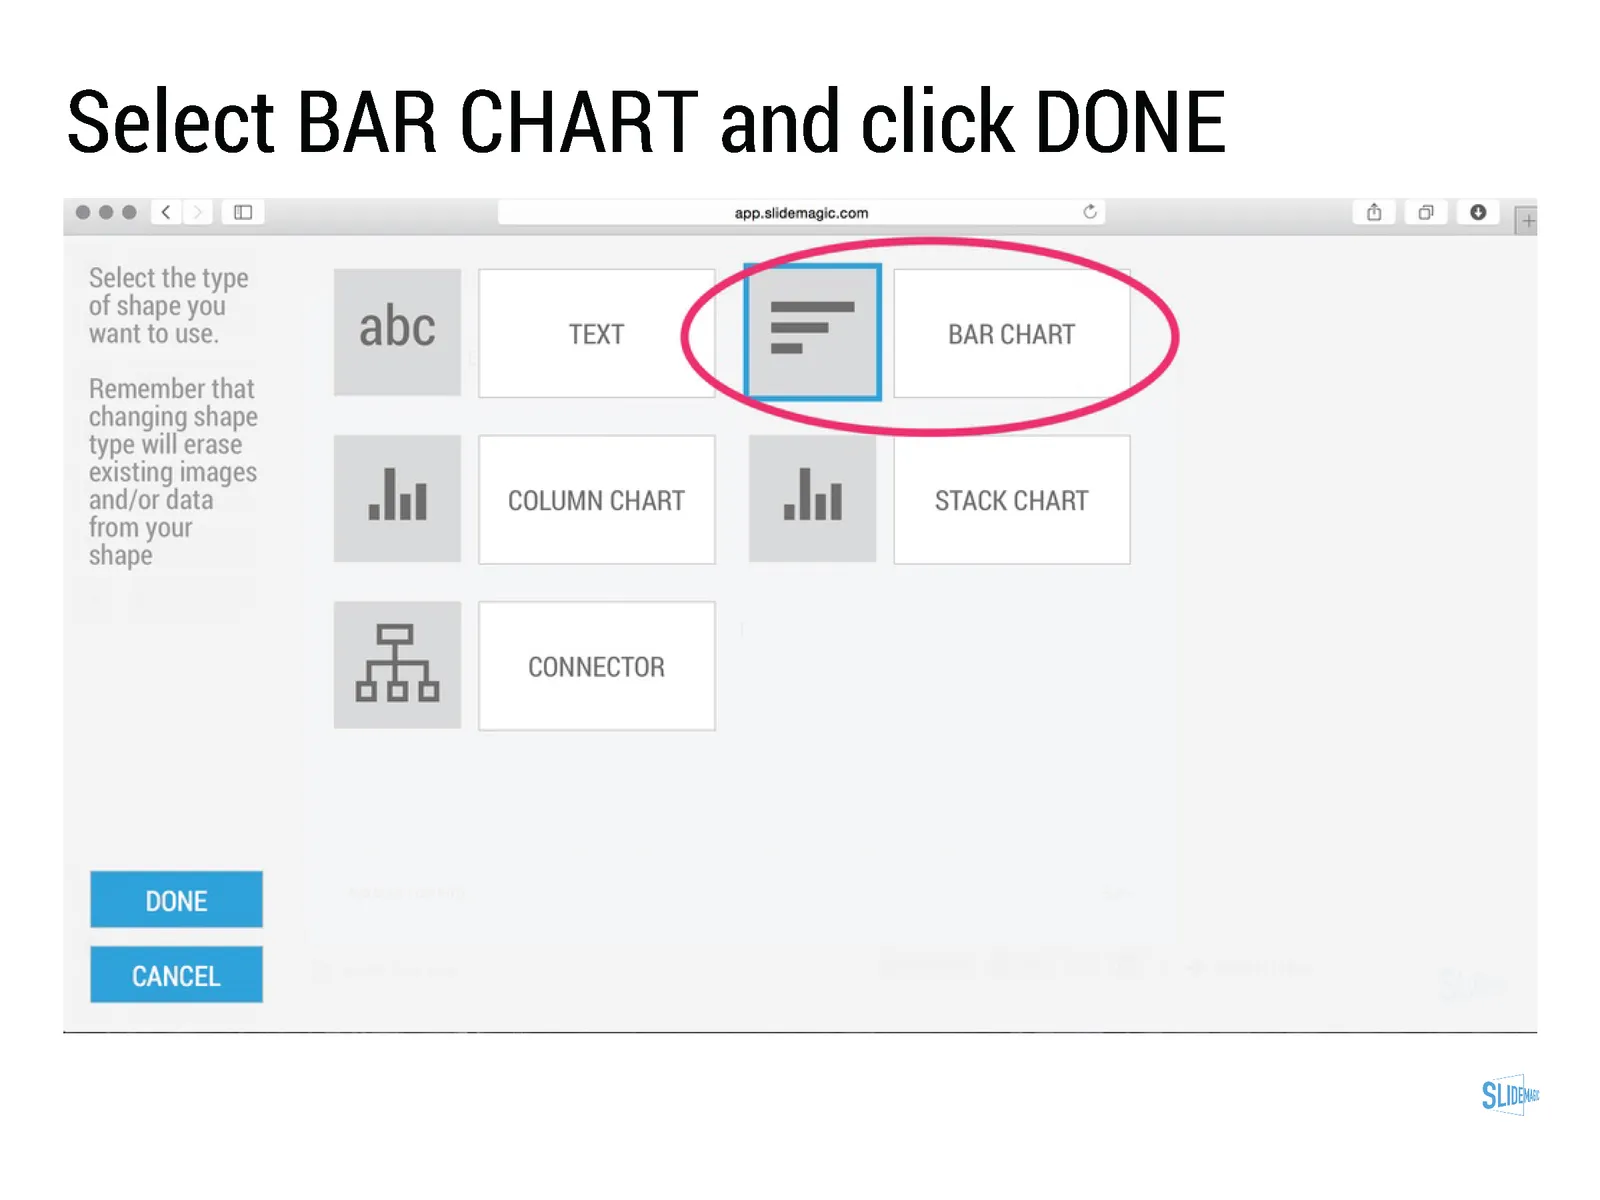
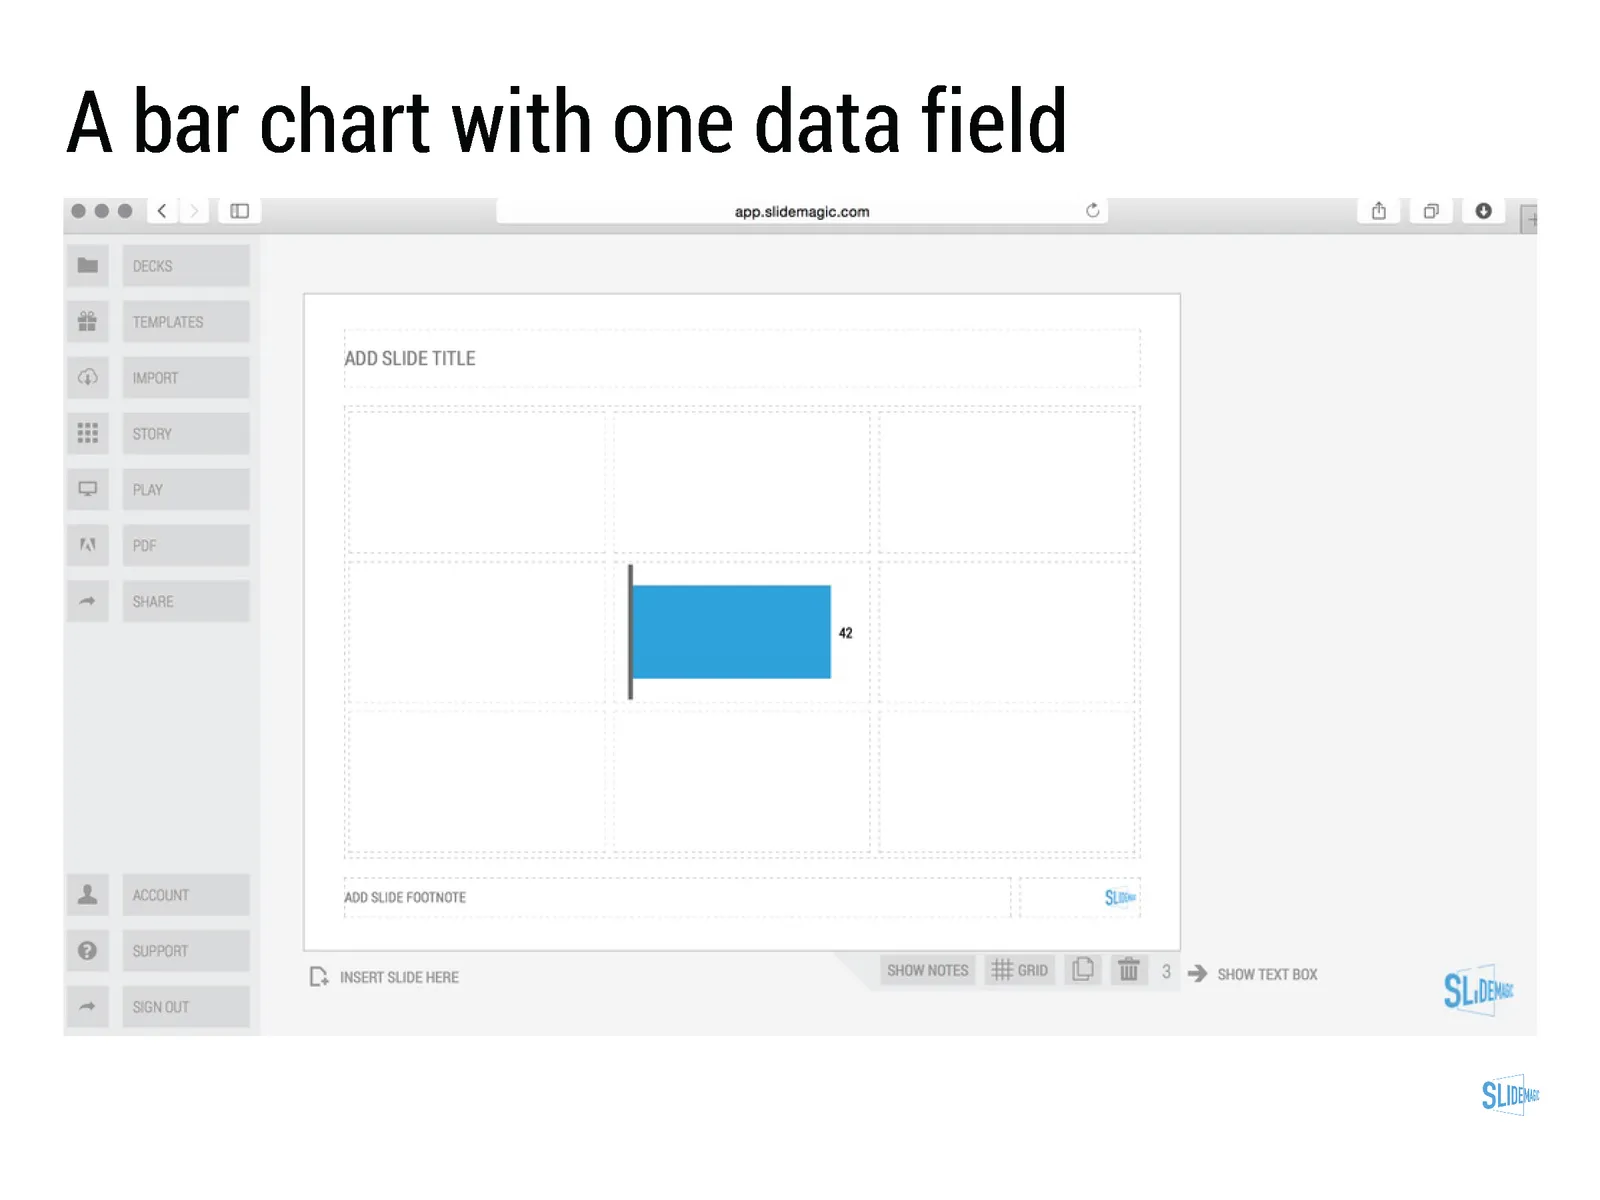
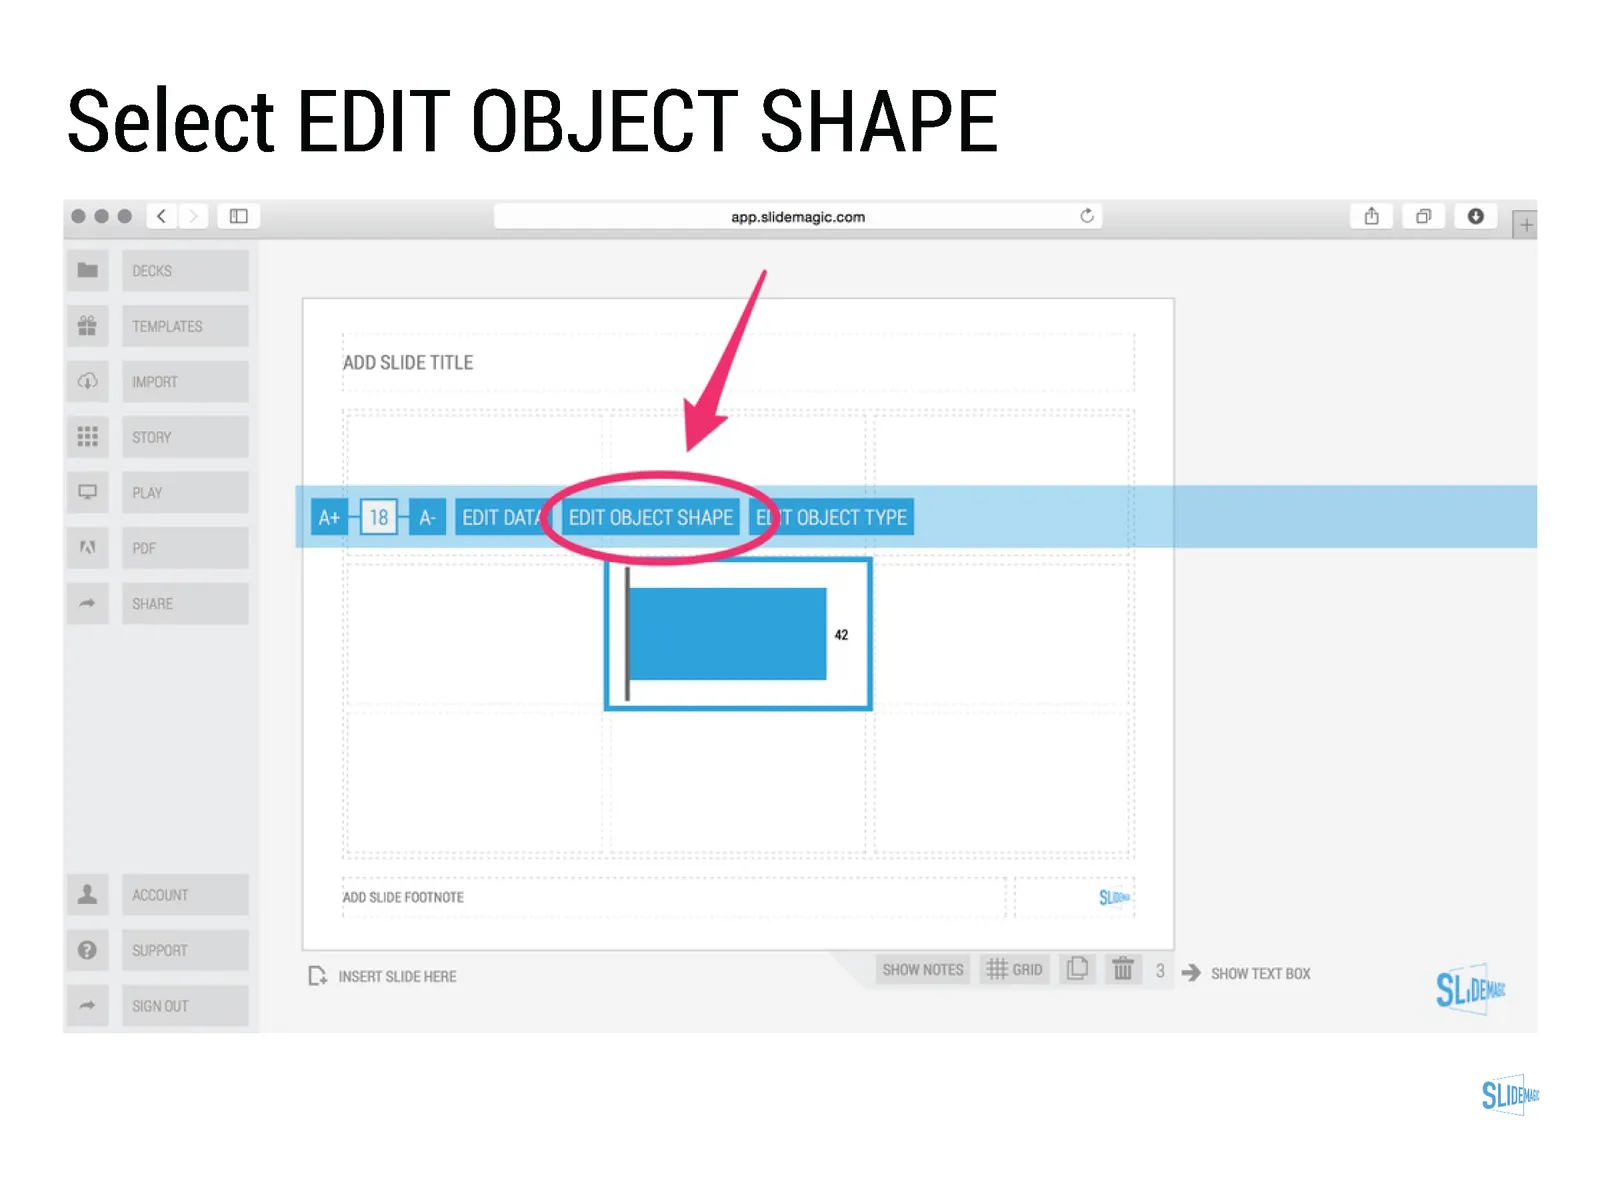
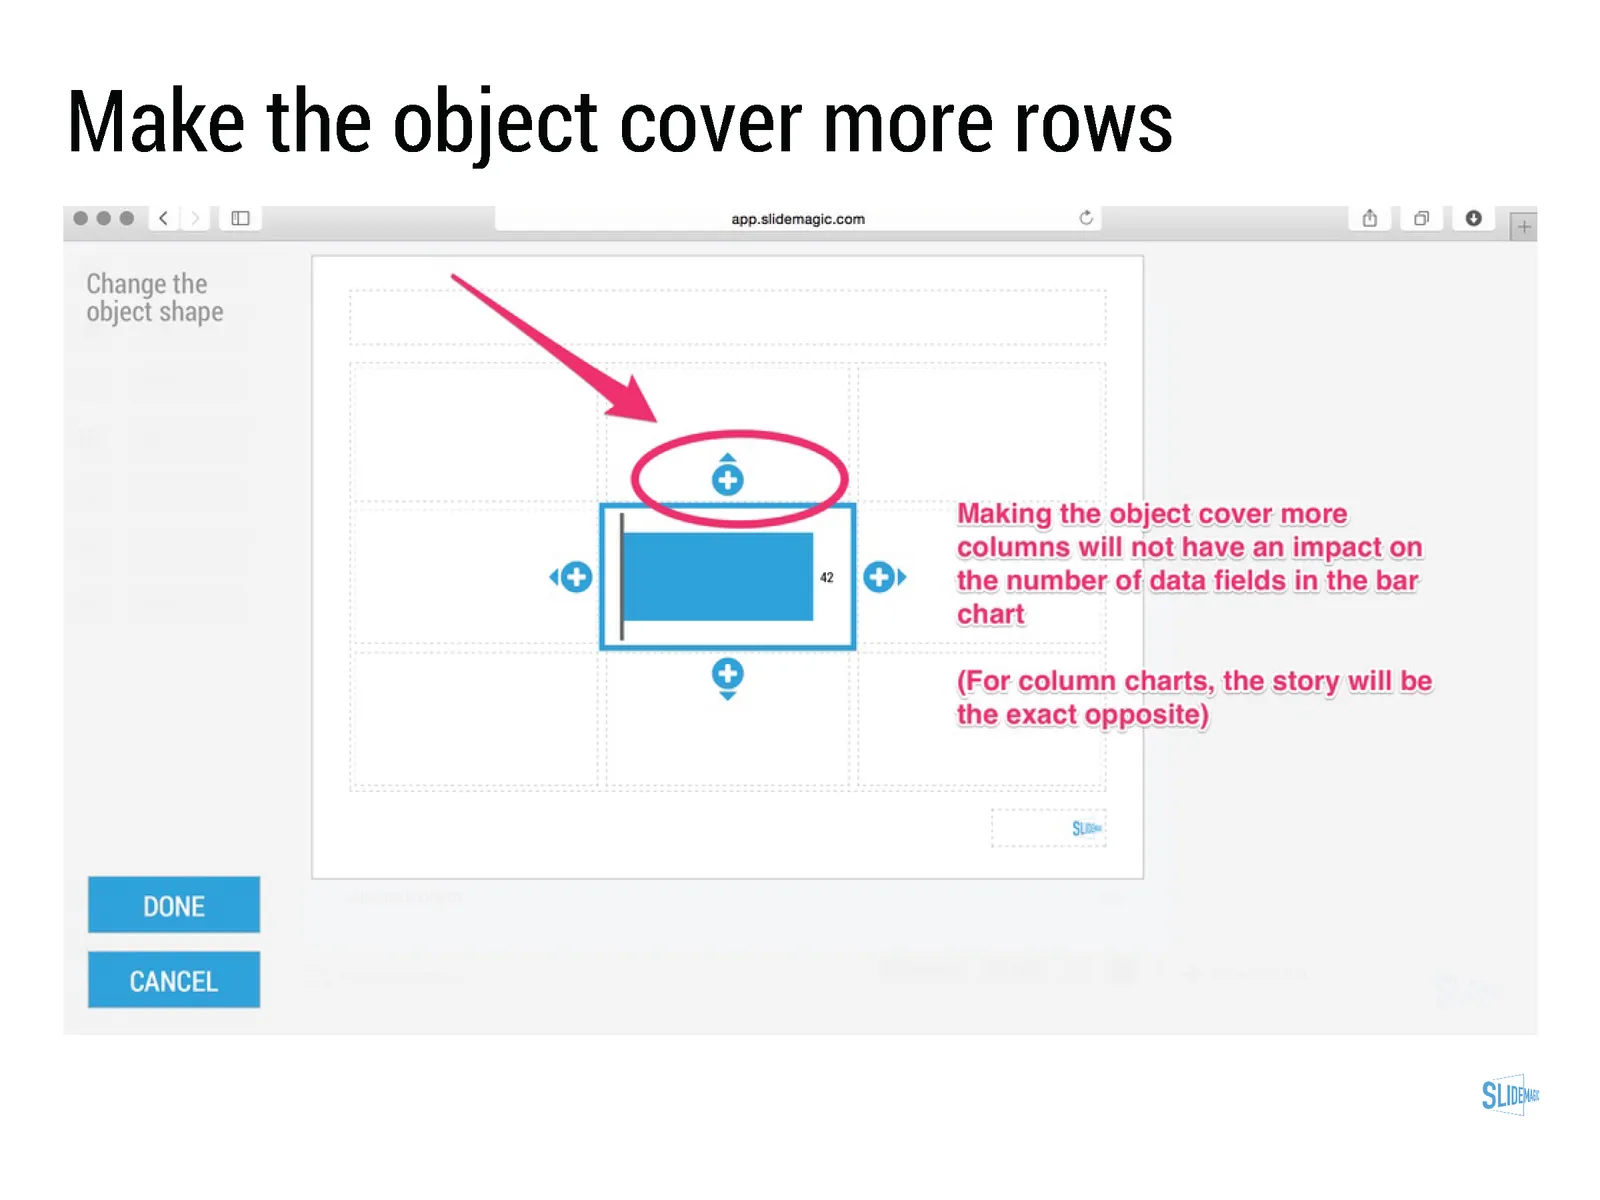
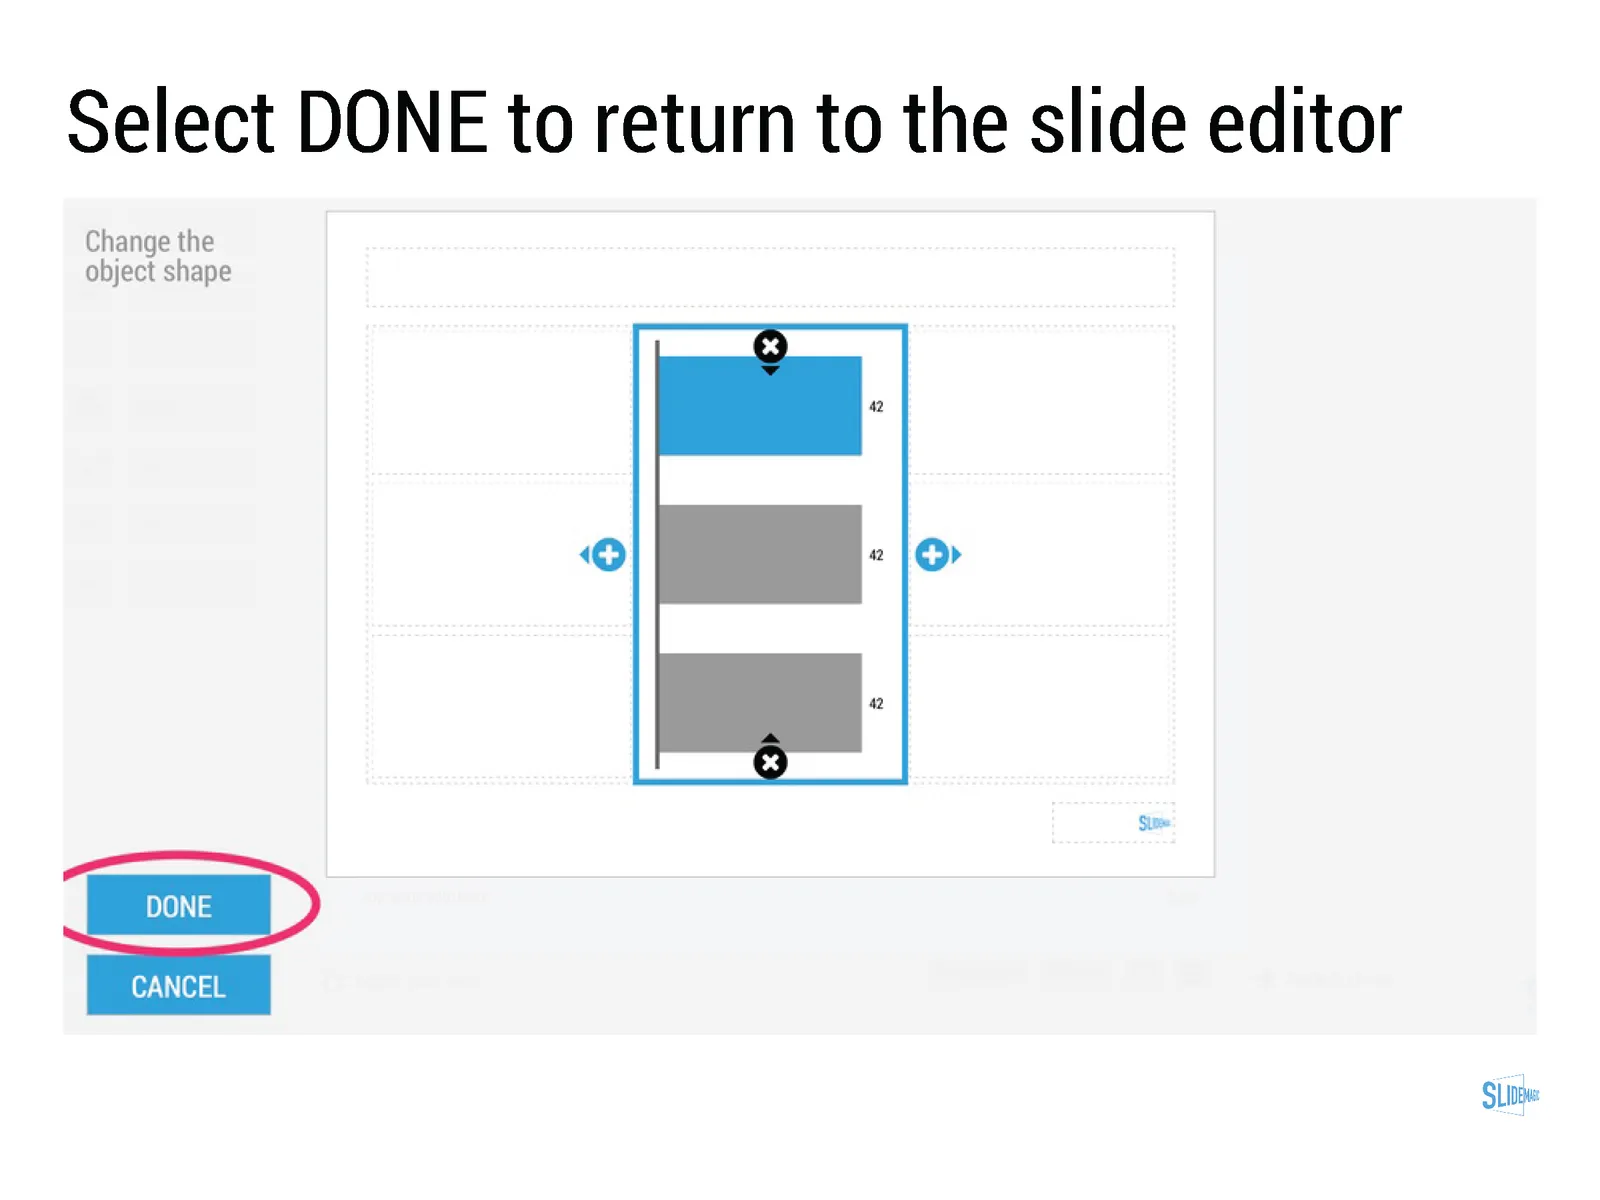
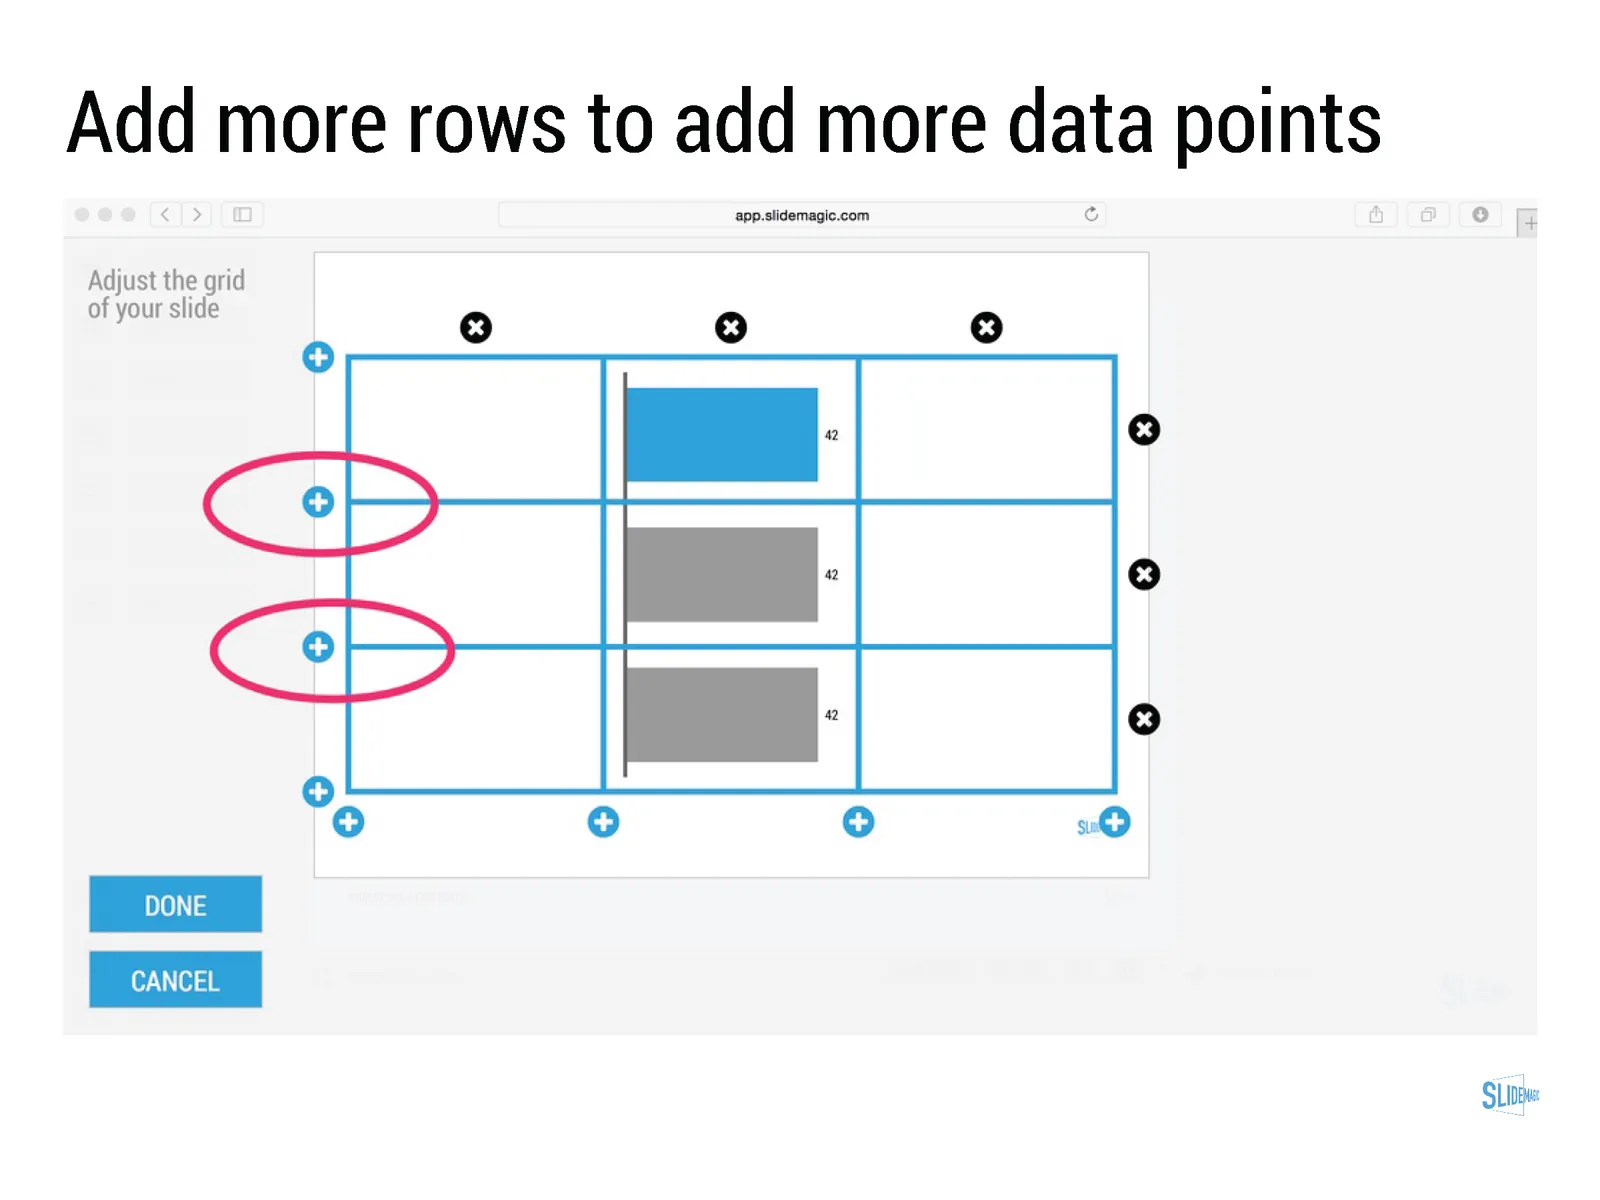
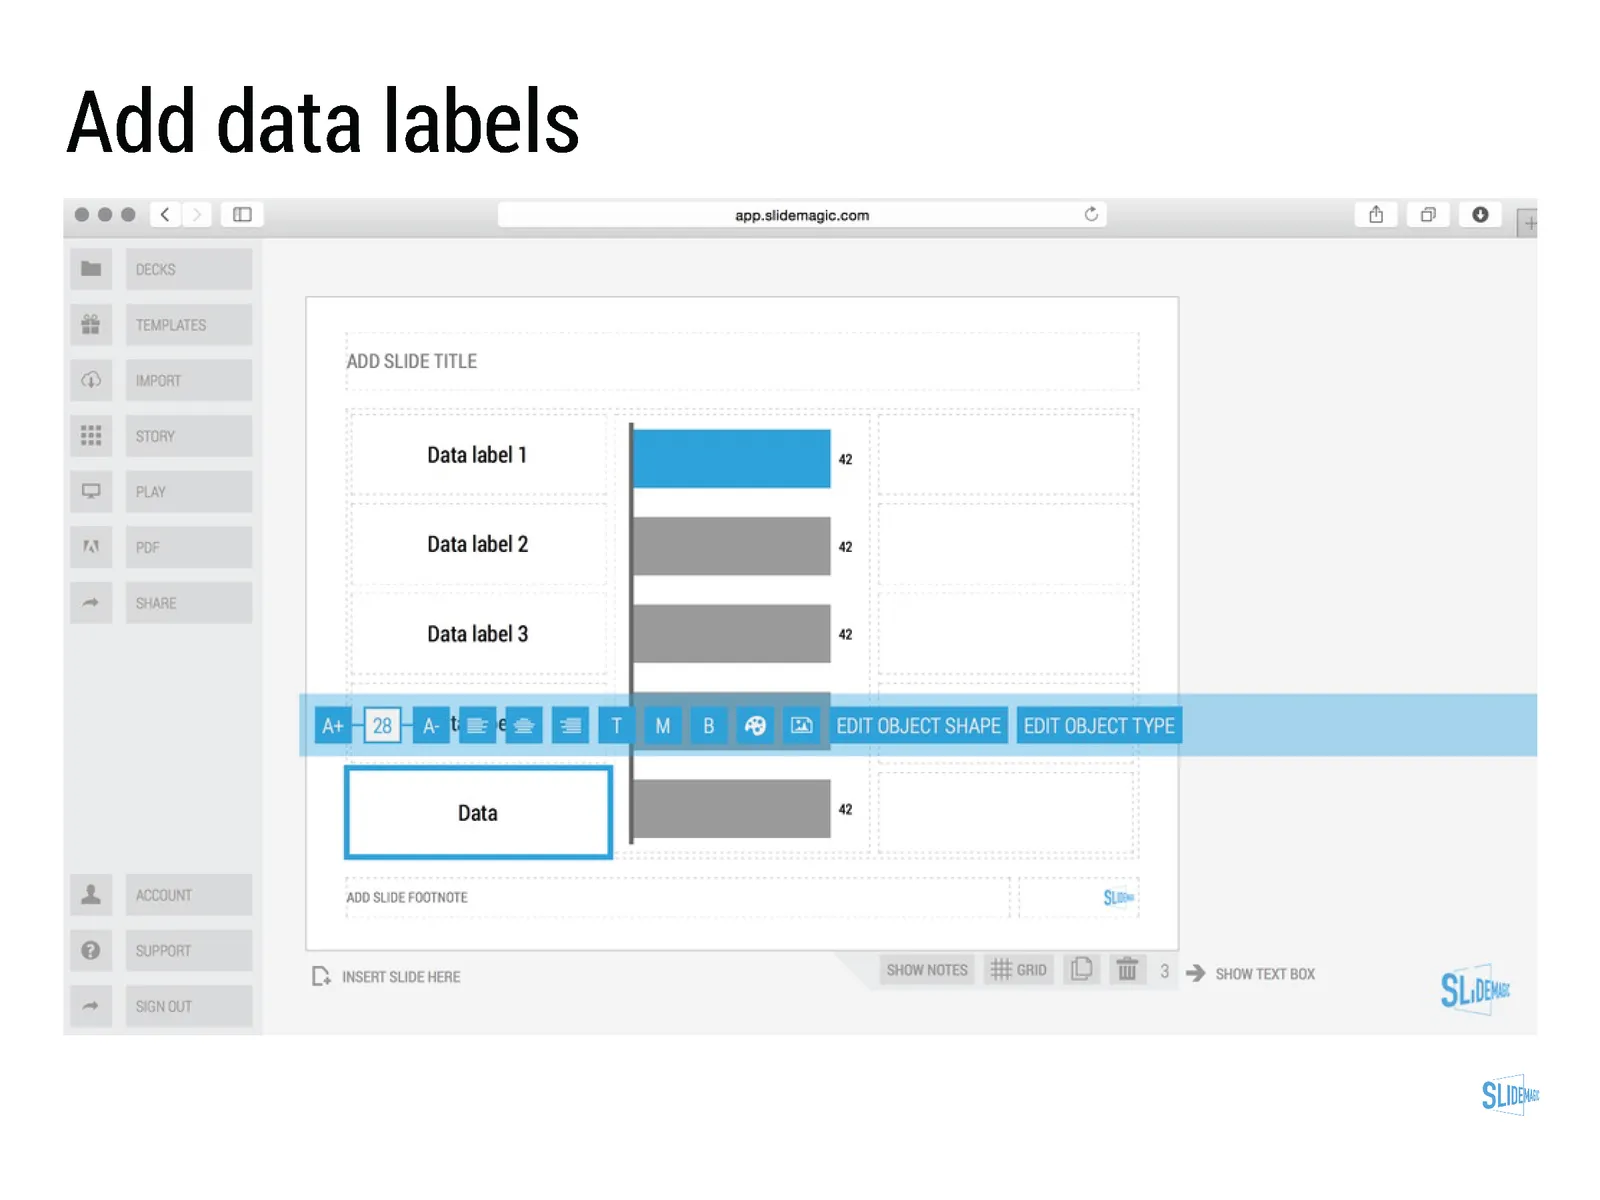
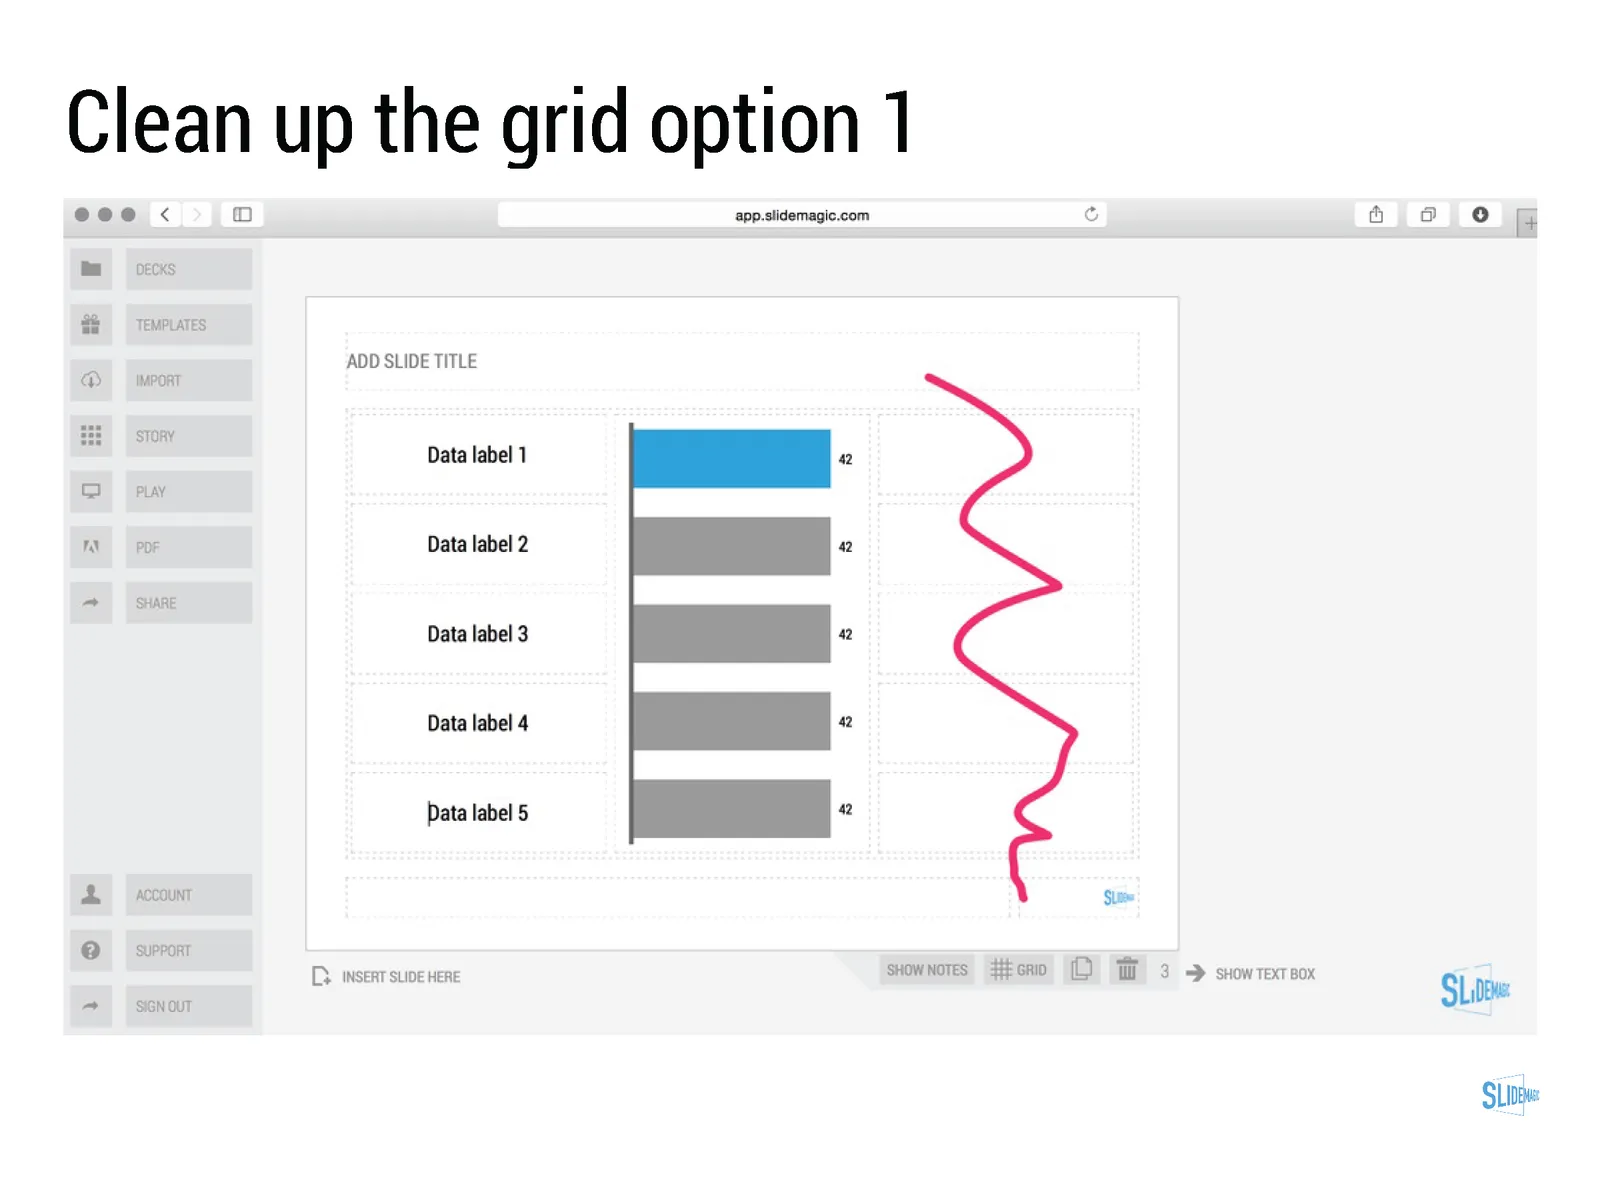
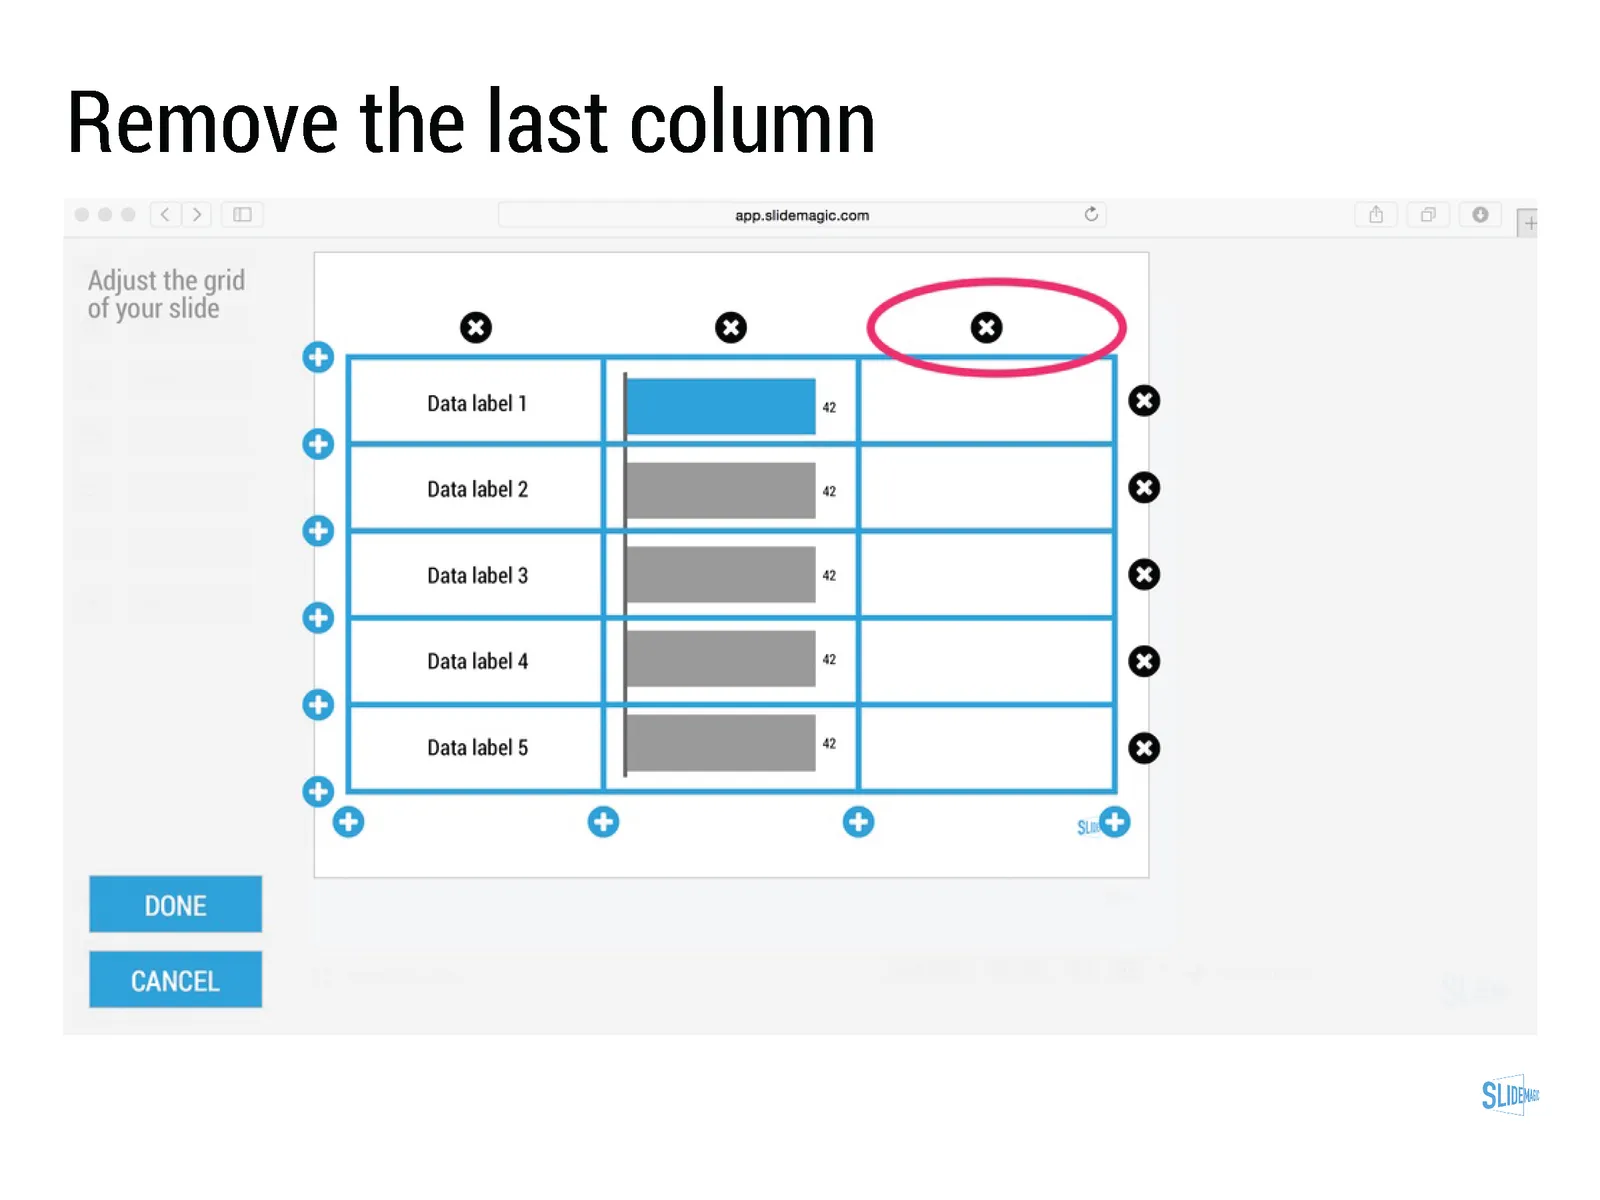
Click through the slide sequence below to get an idea of how you can work with data charts in SlideMagic. Feedback and comments are welcome (comment below, or email me at support @ slidemagic dot com).

Art: Melencolia I. Print by Albrecht Dürer, 1514 Subscribe to this blog, follow me on Twitter